


 11 348

11
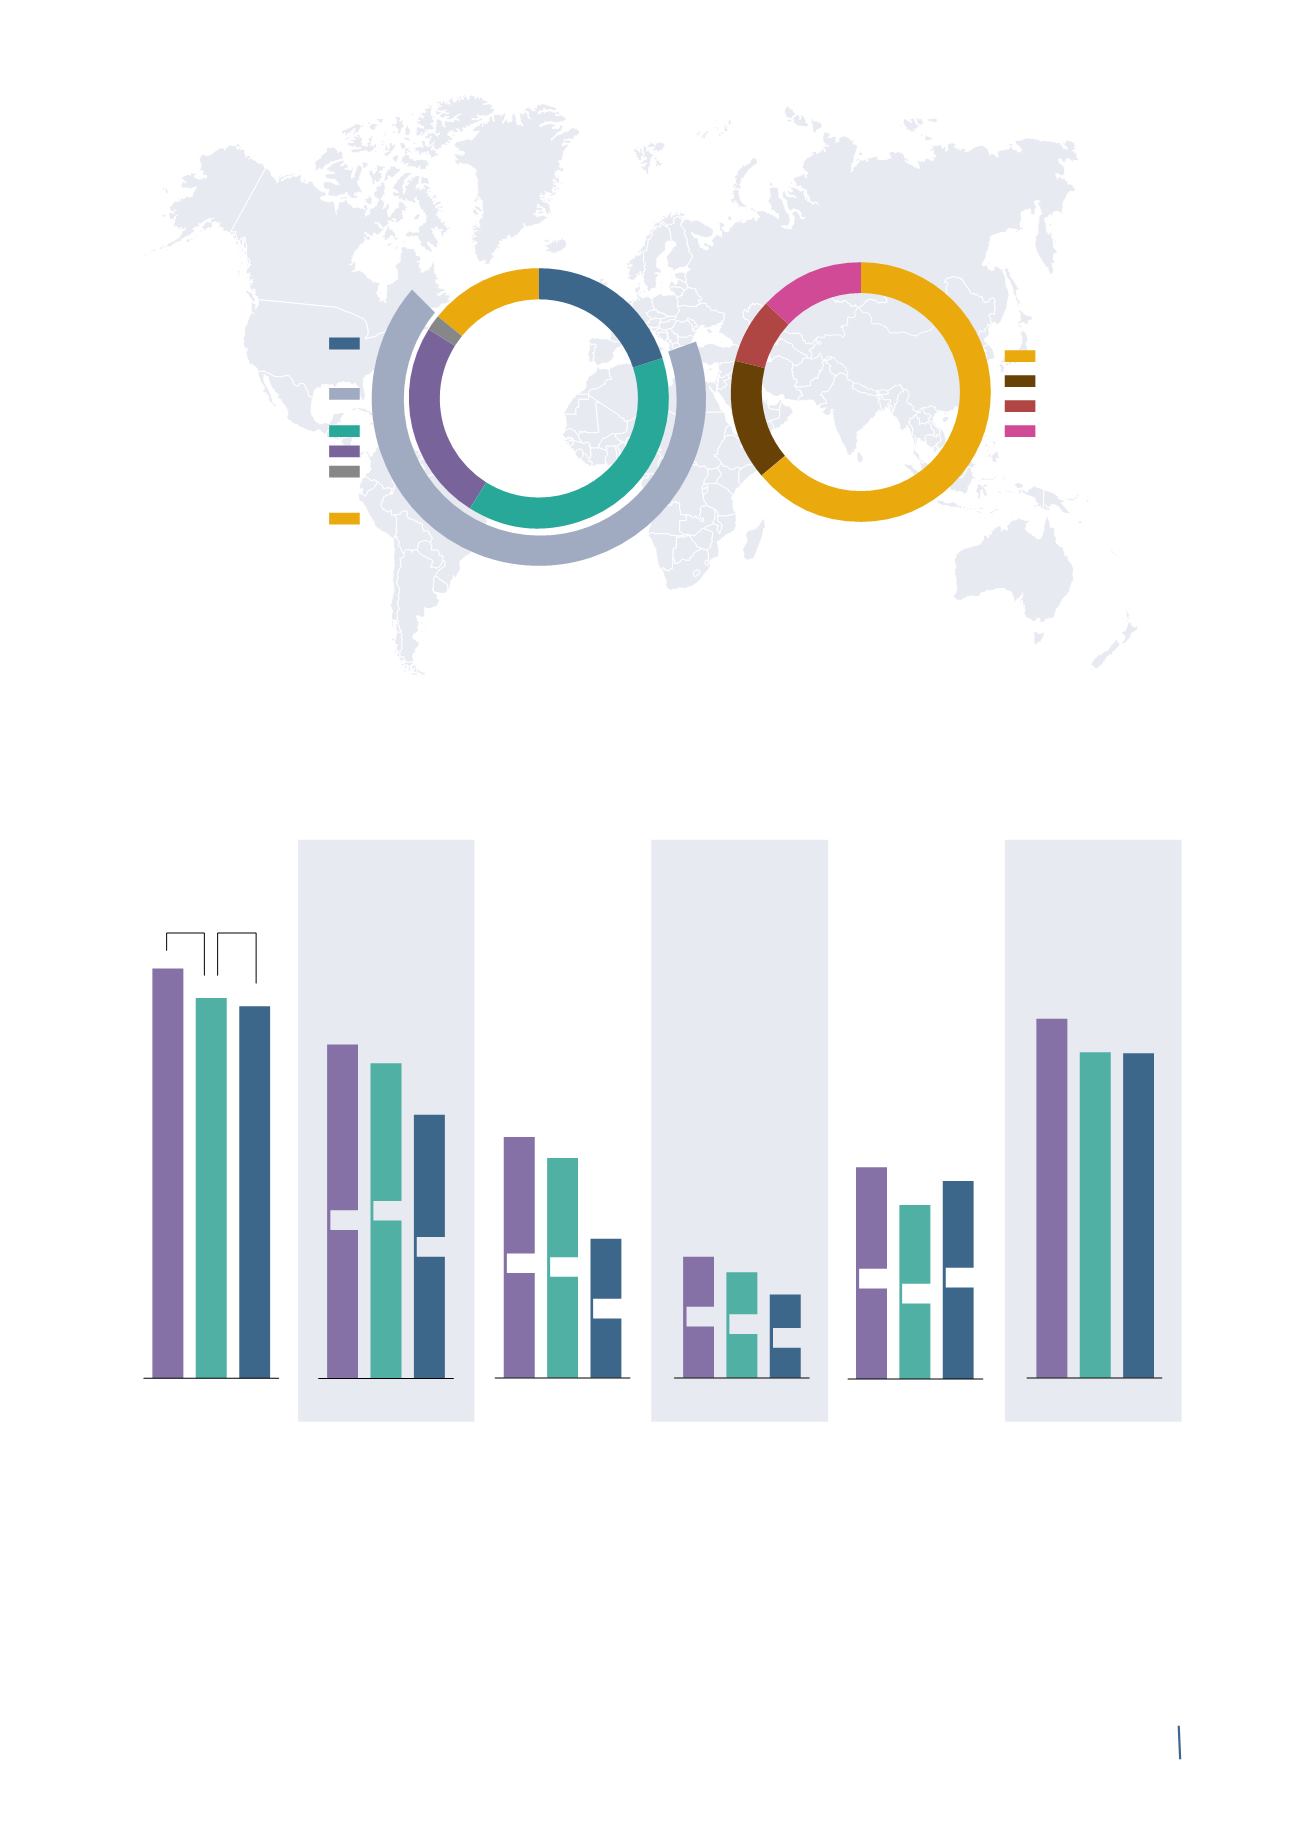
Euro
6,840
million
Euro
6,840
million
EMEA*
64%
North America
15%
APAC
13%
South and Central America
8%
Energy Projects
20%
E&I
39%
of which
Industrial & Network Components
25%
Other
2%
Telecom
14%
SALES 2014 BY BUSINESS AREA
SALES 2014 BY GEOGRAPHICAL AREA
Energy Products
66%
(*) Europe – Middle East – Africa
KEY FINANCIALS
(*)
Amounts in millions of Euro – Percentages on sales
2012 2013 2014
888
805
802
NET FINANCIAL
POSITION
ADJ. EBITDA
(2)
2012 2013 2014
650
613
509
8.6%
8.8%
7.4%
2012 2013 2014
494
465
365
ADJ. OPERATING
INCOME
(3)
2012 2013 2014
279
269
186
ADJ. NET
PROFIT
(4)
2012 2013 2014
440
392
423
NET OPERATING
WORKING
CAPITAL
(5)
SALES
2012 2013 2014
7,574
6,995
6,840
-3.3%
(1)
1.8%
(1)
6.5%
6.7%
5.3%
3.7%
3.8%
2.7%
6.0%
5.8%
5.8%
(*) The previously published prior year comparative figures have been restated following the introduction of IFRS 10 and IFRS 11 and a new method of classifying
the share of net profit (loss) of associates and joint ventures.
1) Organic growth is defined as growth in sales calculated net of changes in the scope of consolidation, change in metal prices and exchange rates effects.
2) Adjusted EBITDA is defined as EBITDA before non-recurring income/(expenses).
3) Adjusted Operating Income is defined as Operating Income before non-recurring income/(expenses) and the fair value change in metal derivatives and in
other fair value items.
4) Adjusted Net Profit is defined as net profit/(loss) before non-recurring income/(expenses), the effect of derivatives and of other fair value items, exchange
rate differences, non-monetary interest on the convertible bond and the related tax effects.
5) Net Operating Working Capital means Net Working Capital excluding the effect of derivatives. The percentage is calculated as Net Working Capital/
Annualised last-quarter sales.