


 13 / 34

13
Capital expenditure rose to € 163 million in
2014, +20% vs. 2013. The main reason for the
increase is linked to the strategic Submarine
business, where investments to increase
production capacity and develop additional
technological capabilities were made at all
three production sites located in Arco Felice
(Italy), Pikkala (Finland) and Drammen
(Norway). Also of note was the upgrade of the
“Cable Enterprise” cable-laying ship which
Investing in high value-added businesses
will additionally boost the Group’s submarine
project execution capabilities.
A significant proportion of overall capital
expenditure was devoted to improving
efficiency in order to reduce fixed and
variable costs, with a focus on product design
and experimentation with new materials.
In the optical fibre field, the investment
programme to recover fibre manufacturing
competitiveness continued to move ahead.
2012 2013 2014
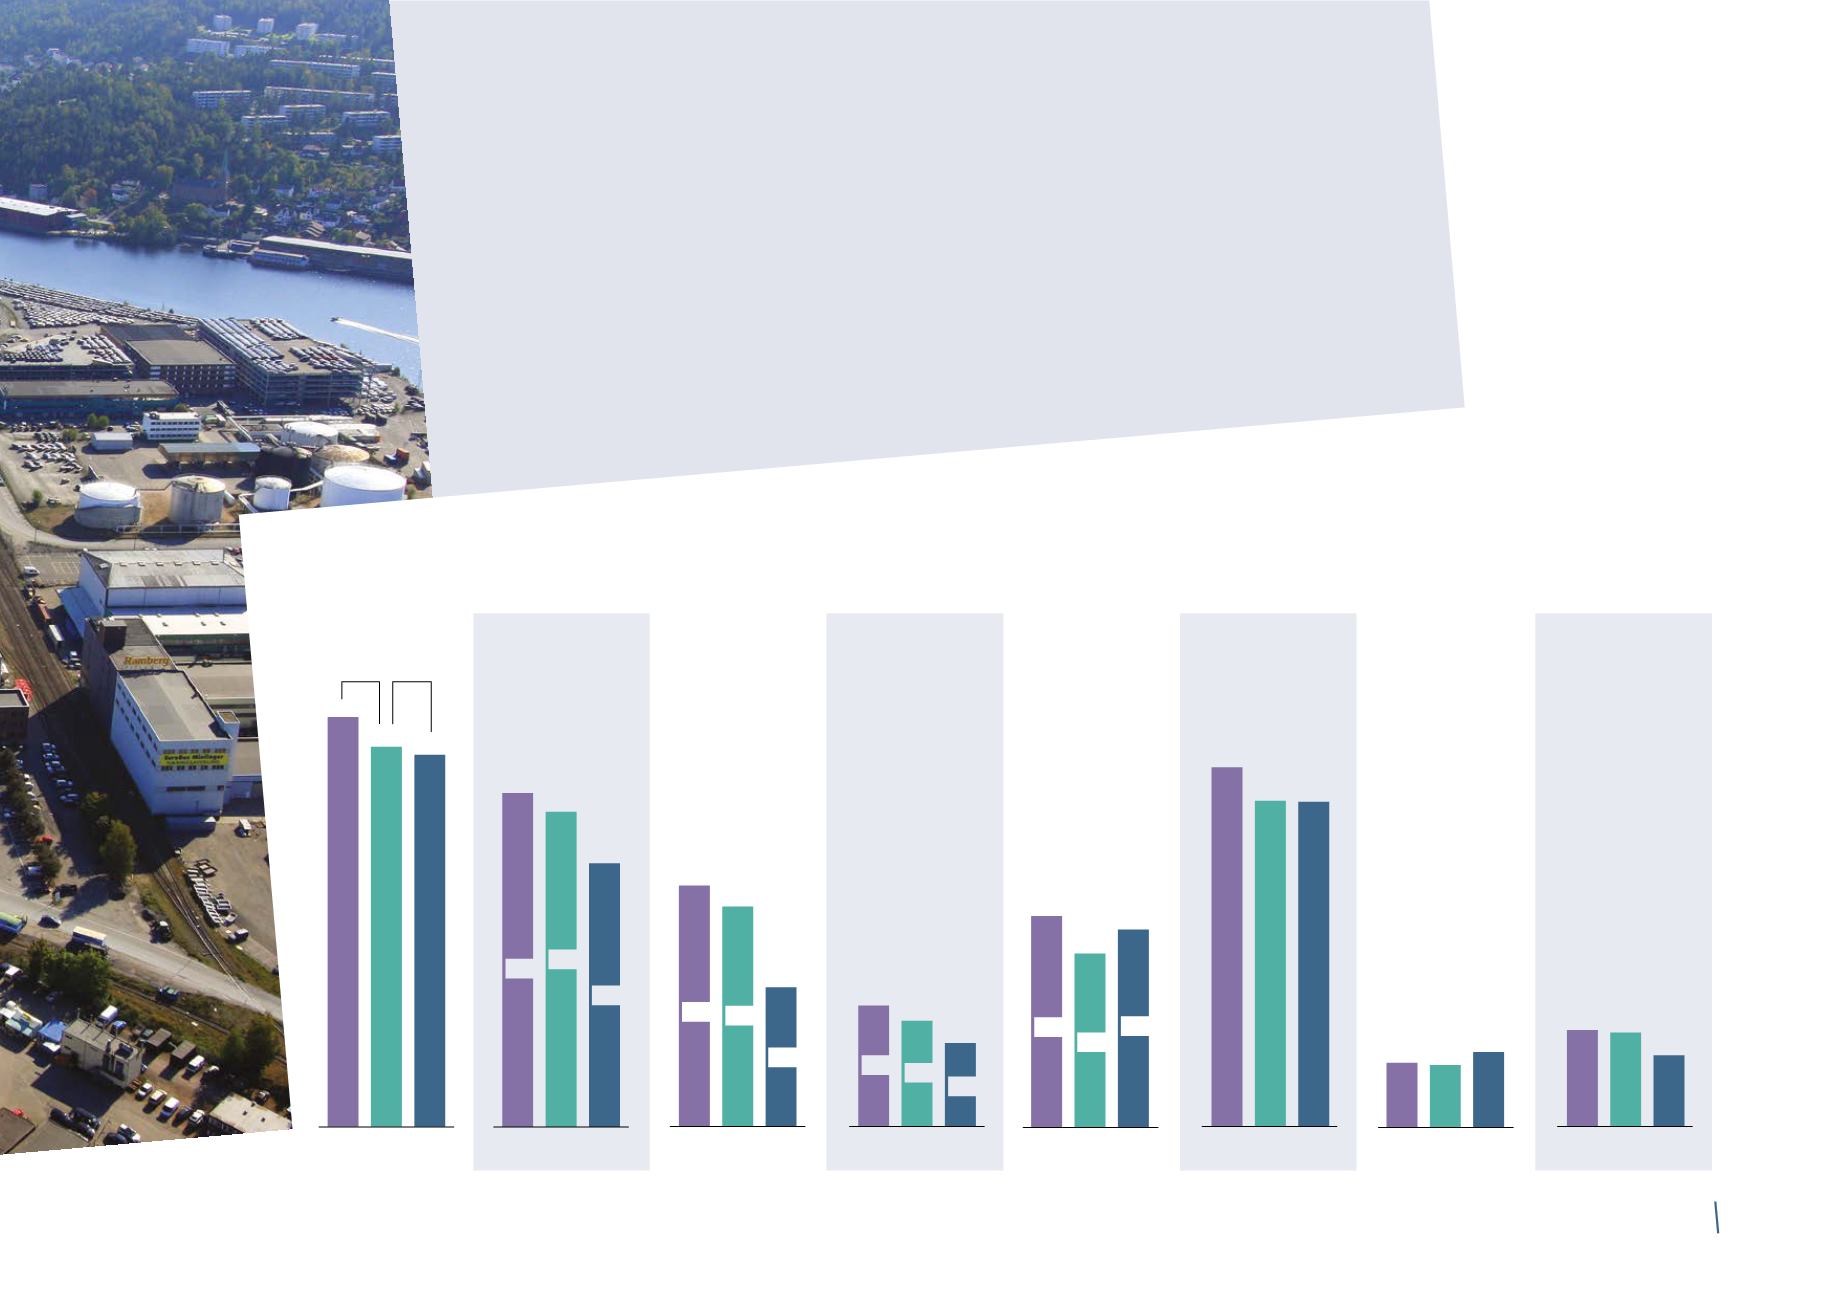
888
805
802
NET FINANCIAL
POSITION
ADJ. EBITDA
2012 2013 2014
650
613
509
8.6%
8.8%
7.4%
2012 2013 2014
494
465
365
ADJ. OPERATING
INCOME
2012 2013 2014
279
269
186
ADJ. NET PROFIT
2012 2013 2014
440
392
423
NET OPERATING
WORKING
CAPITAL
SALES
2012 2013 2014
7,574
6,995
6,840
-3.3% 1.8%
6.5%
6.7%
5.3%
3.7%
3.8%
2.7%
6.0%
5.8%
5.8%
2012 2013 2014
20.8%
20.3%
15.6%
ROCE
2012 2013 2014
139
136
163
CAPEX
Key financials
Amounts in millions of Euro - Percentages on sales
Note: Euro million
CAPEX