111
COMMENTS
Power cables
The reduction of almost 5% in the quantity of hazardous
waste disposed of per tonne of production was
accompanied by a very slight decrease in the total quantity.
The time interval for the cleaning of machines, which
generates waste emulsions and sludge, exceeds one
year in many cases, resulting in a slightly erratic flow of
waste disposal. In addition, in certain cases, the type of
production also affects the nature and quantity of waste.
Improvements at a number of factories have contributed to
lowering the quantities generated, in particular:
• At one Italian factory, the quantity of sludge from
processing was reduced by using a centrifuge to
separate out the dust accumulated in lubricating oil,
thus extending its life. In addition, improvements
made to the seals of the machines concerned resulted
in lower oil consumption and a reduction in the
quantities to be eliminated.
• A cleansing chamber for solvents was activated in
Malaysia, thus extending their useful lives and lowering
the replacement rate and, of course, the quantities
to be eliminated. In addition, marking processes
have been optimised via a series of operational
improvements.
• For example, a system for checking the ageing of oil
has been implemented at a factory in the USA, with a
view to reducing the frequency of replacement.
Accessories
There has been a reduction in the disposal of hazardous
waste by about 8%, largely due to solving a problem of
losses that arose at a French site during 2011.
Telecom Cables
There was a very substantial reduction, almost 40%, in
the quantities eliminated, both in absolute terms and in
relation to kilometres of production.
However, this change was partly due to the time taken to
implement the data collection tools in 2011, following the
union with Draka. Given this, it was necessary to revise the
data of certain factories included only recently within the
scope of reporting. In addition, the quantity of hazardous
waste reported by an Australian factory has dropped
drastically. Checks on the reliability of this data are still in
progress.
Improvements have been made at a Brazilian factory
by reducing the quantity of solvents used for cleaning
purposes.
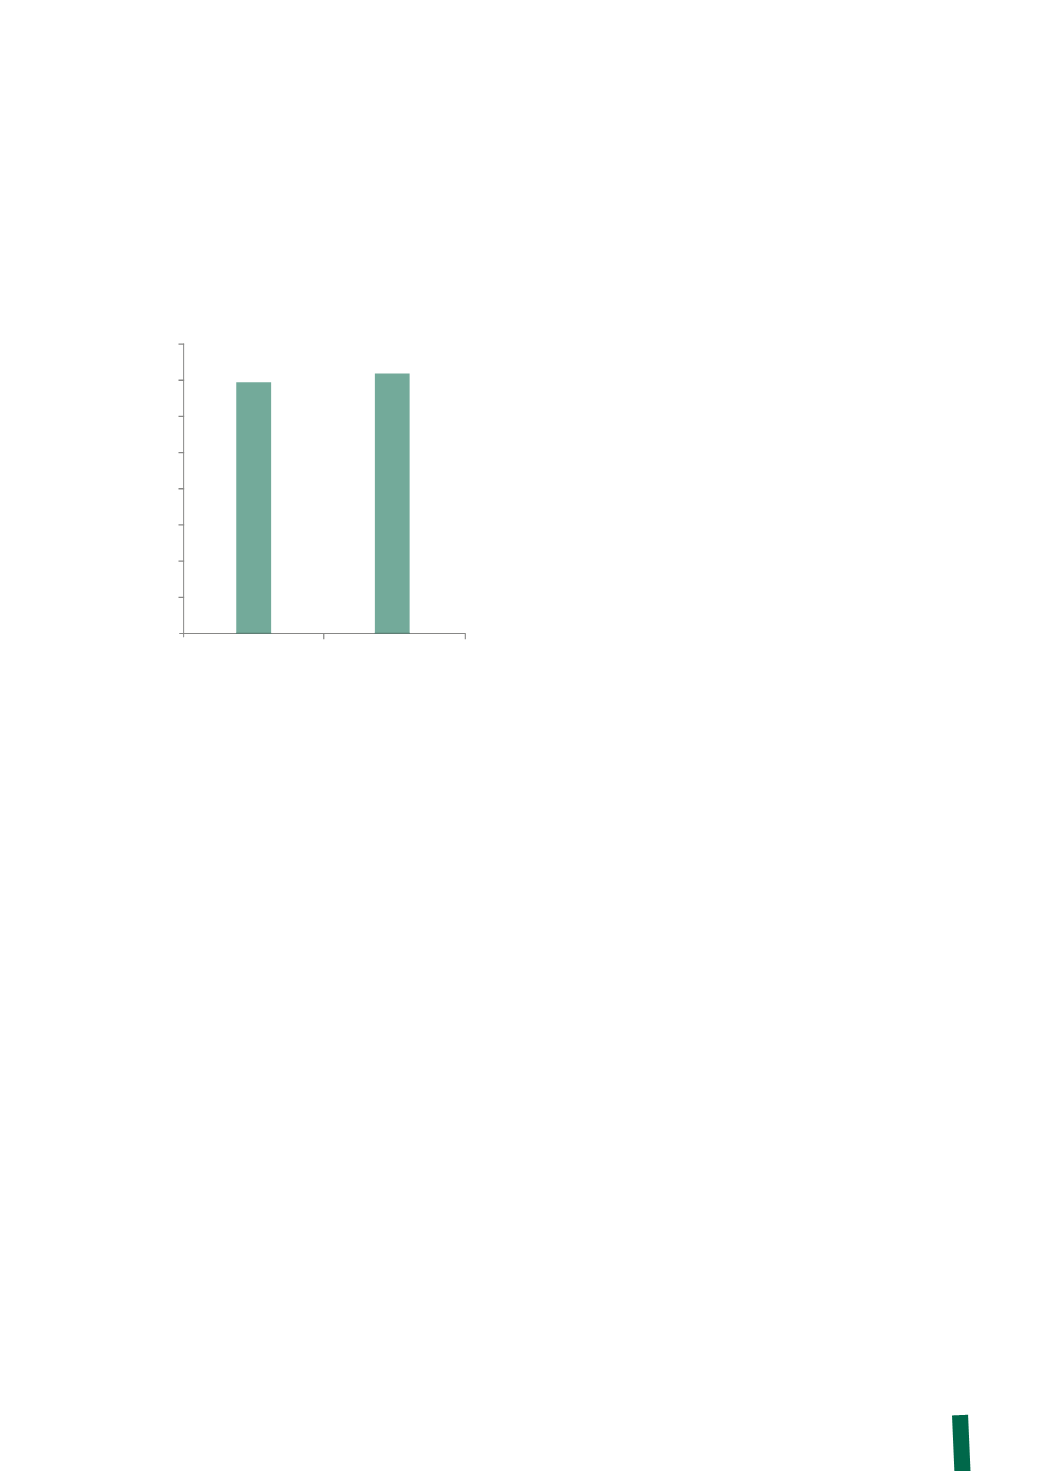
CHARTS FOR EACH CATEGORY OF PRODUCT
0.000
0.010
0.030
0.050
0.020
0.060
0.040
0.070
0.080
0.070
2012
2011
OPTICAL FIBRE
Hazardous waste disposed per kilometer of product (kg/km)
0.072


