2012 Sustainability Report
112
| prysmian group | 2012 Sustainability Report
NON-HAZARDOUS WASTE
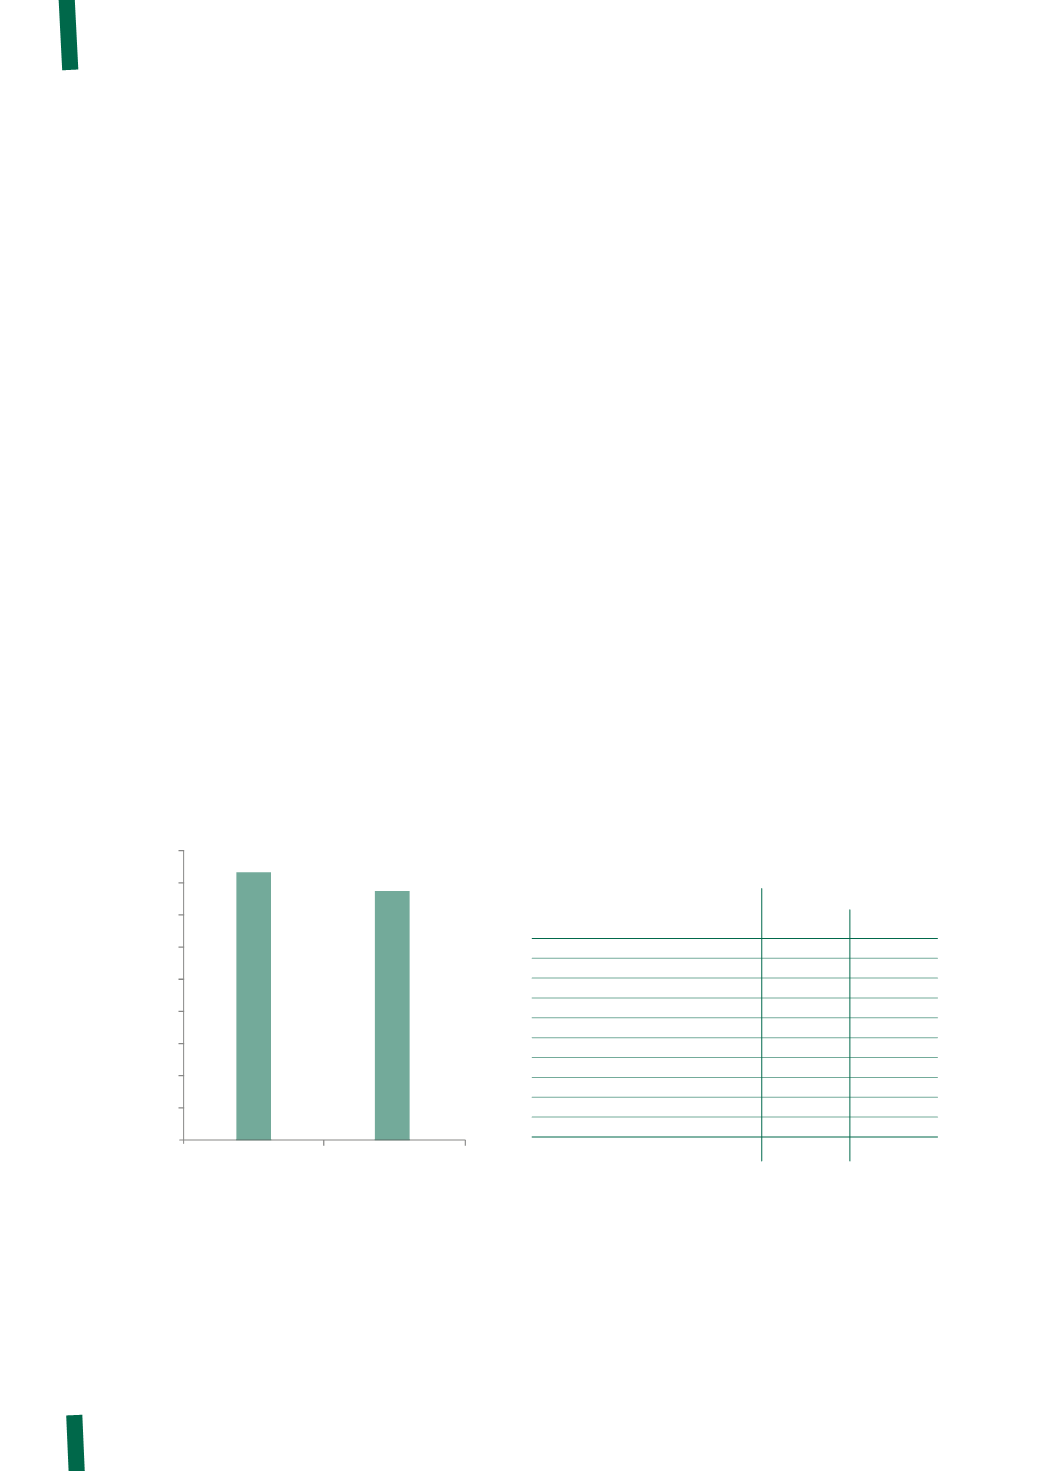
The following chart shows the total quantity of non-hazardous
waste disposed of during the two years covered by this Report.
The table below provides a breakdown by caption.
Charts and related results for each category of product are
presented below.
Lastly, as mentioned in relation to power cables, the time
interval for the cleaning of machines, which generates
waste emulsions and sludge, exceeds one year in many
cases, resulting in a slightly erratic flow of waste disposal.
Optical fibre
The absolute quantity of hazardous waste eliminated
has risen by about 8%, while the increase in terms of
units produced was about 2.5%. This is explained by
higher production of coloured fibres (which generate
larger quantities of waste solvents) and by the disposal of
batteries.
One US factory has implemented a system for recycling
solvents, thus considerably reducing the quantities of
waste solvents sent for disposal.
>
ENVIRONMENTAL RESPONSIBILITY
TYPES OF NON-HAZARDOUS WASTE
Quantity disposed (kg)
2011
2012
Waste compounds
15,071,873
15,075,798
Non-hazardous packaging
16,491,044 15,756,990
Non-hazardous ingredients for compounds
1,192,219
2,591,243
Sludge from treatment of emissions
338,450
395,810
Sludge from cleansing of civil water
1,175,688
1,224,450
Sludge from cleansing of industrial water
451,160
149,290
Urban waste
15,120,141
14,733,195
Wood
157,790
153,945
Alkaline waste
0
0
Other non-hazardous materials
33,173,963
27,981,641
Total
83,172,327
78,062,361
0
10,000,000
30,000,000
40,000,000
60,000,000
80,000,000
20,000,000
50,000,000
70,000,000
90,000,000
83,172,327
2012
2011
PRYSMIAN GROUP Non-hazardous waste disposed (kg)
78,062,361


