


 50 80
50 80

5.
EFFICIENCY CONTINUOUSLY INCREASING
PRYSMIAN GROUP
2015
YEARLY OVERVIEW
ENVIRONMENTAL AND SAFETY
MANAGEMENT SYSTEM
The environment and safety management
system has been set up centrally to ensure
a uniform approach across the Group and is
coordinated by the central HSE function, which
particularly establishes preventive and corrective
actions applicable at Group level and audits their
effectiveness at local level; this system has
helped maintain and establish high standards,
also thanks to the creation of a qualified team
of HSE auditors within the Group. In the future
there will be even greater “coordination from
the centre”, with a gradual transformation into a
“multi-site”model, certifiedby a series of annual
audits byHeadOffice. The purpose is tomake the
most of synergies and efficiency gains that the
systemproduces, in terms of better performance
and even more cost efficiencies.
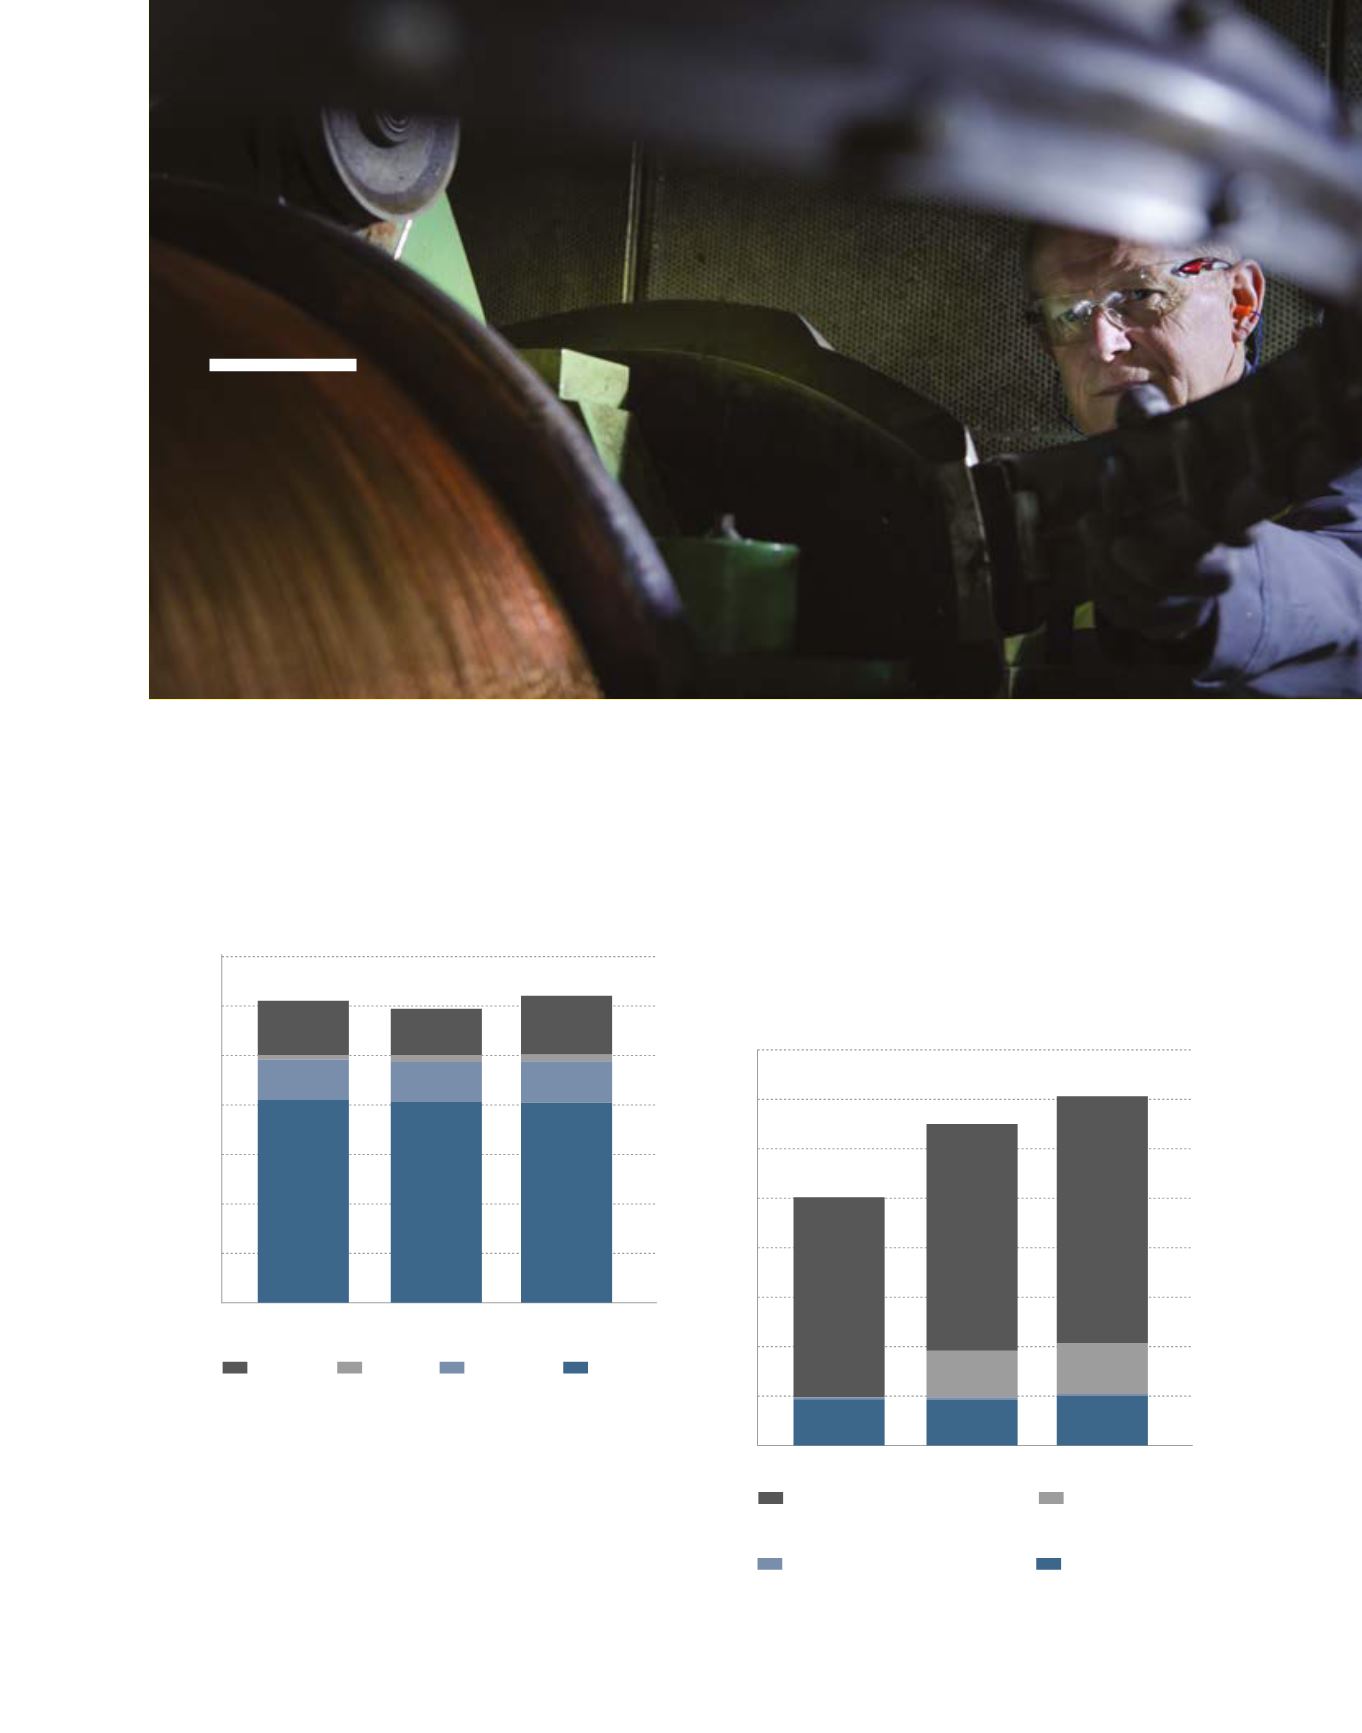
Energy consumption by the Group totalled 6,189,328 GJ in 2015,
an increase of 3.8% compared with 2014 mainly due to higher
consumption in the optical fibre area.
Emissions of greenhouse gases, measured by CO
2
- equivalent weight,
arecalculatedusingthemethodologycontainedinthe“TheGreenhouse
Gas Protocol: A Corporate Accounting and Reporting Standard (Revised
Edition, 2004)”, considering, for the purposes of SCOPE 1 (direct)
emissions, fuel consumption data, the escape of refrigerant gases
and use of SF6, and for the purposes of SCOPE 2 (indirect) emissions,
purchased energy consumption (mainly electricity).
Energy
Greenhouse gas emissions
ENERGY CONSUMPTION (GJ)
CO
2
EMISSIONS, BROKEN DOWN BY SCOPE 1 AND SCOPE 2 (TCO
2
EQ)
2,000,000
3,000,000
4,000,000
5,000,000
7,000,000
6,000,000
1,000,000
0
Power cables
Accessories
Telecom cables
Optical fibre
2013
2014
2015
6,159,314
772,001
71,536
1,136,746
4,179,032
5,960,606
697,505
73,072
1,054,438
4,135,591
6,189,327
711,318
75,982
1,362,169
4,039,858
200,000
300,000
400,000
500,000
700,000
800,000
600,000
100,000
0
Direct emissions deriving from
the combustion of fuel (SCOPE 1)
Direct emissions deriving
from the use of SF6 (SCOPE 1)
Direct emissions deriving from the
escape of refrigerant gas (SCOPE 1)
Indirect emissions deriving from
the purchase of energy, mostly
electricity (SCOPE 2)
2013
2014
2015
527,196
4,736
432,770
89,690
655,487
96,750
73,072
473,350
81,587
718,667
117,153
3,104
493,513
104,897