
CONSOLIDATED FINANCIAL REPORT | EXPLANATORY NOTES
198
As described in Note 1. Property, plant and equipment, at 31 December 2015 the Prysmian Group has
reviewed whether there was any evidence that its CGUs might be impaired, and has then tested for
impairment those CGUs potentially at "risk".
This test has led to the recognition of Euro 3 million in impairment losses against Other intangible assets and
Intangibles in progress in the CGU Energy Products - Brazil.
Goodwill impairment test
As reported earlier, management reviews operating performance by macro type of business. Goodwill has
therefore been monitored internally at the level of the three operating segments: Energy Projects, Energy
Products and Telecom.
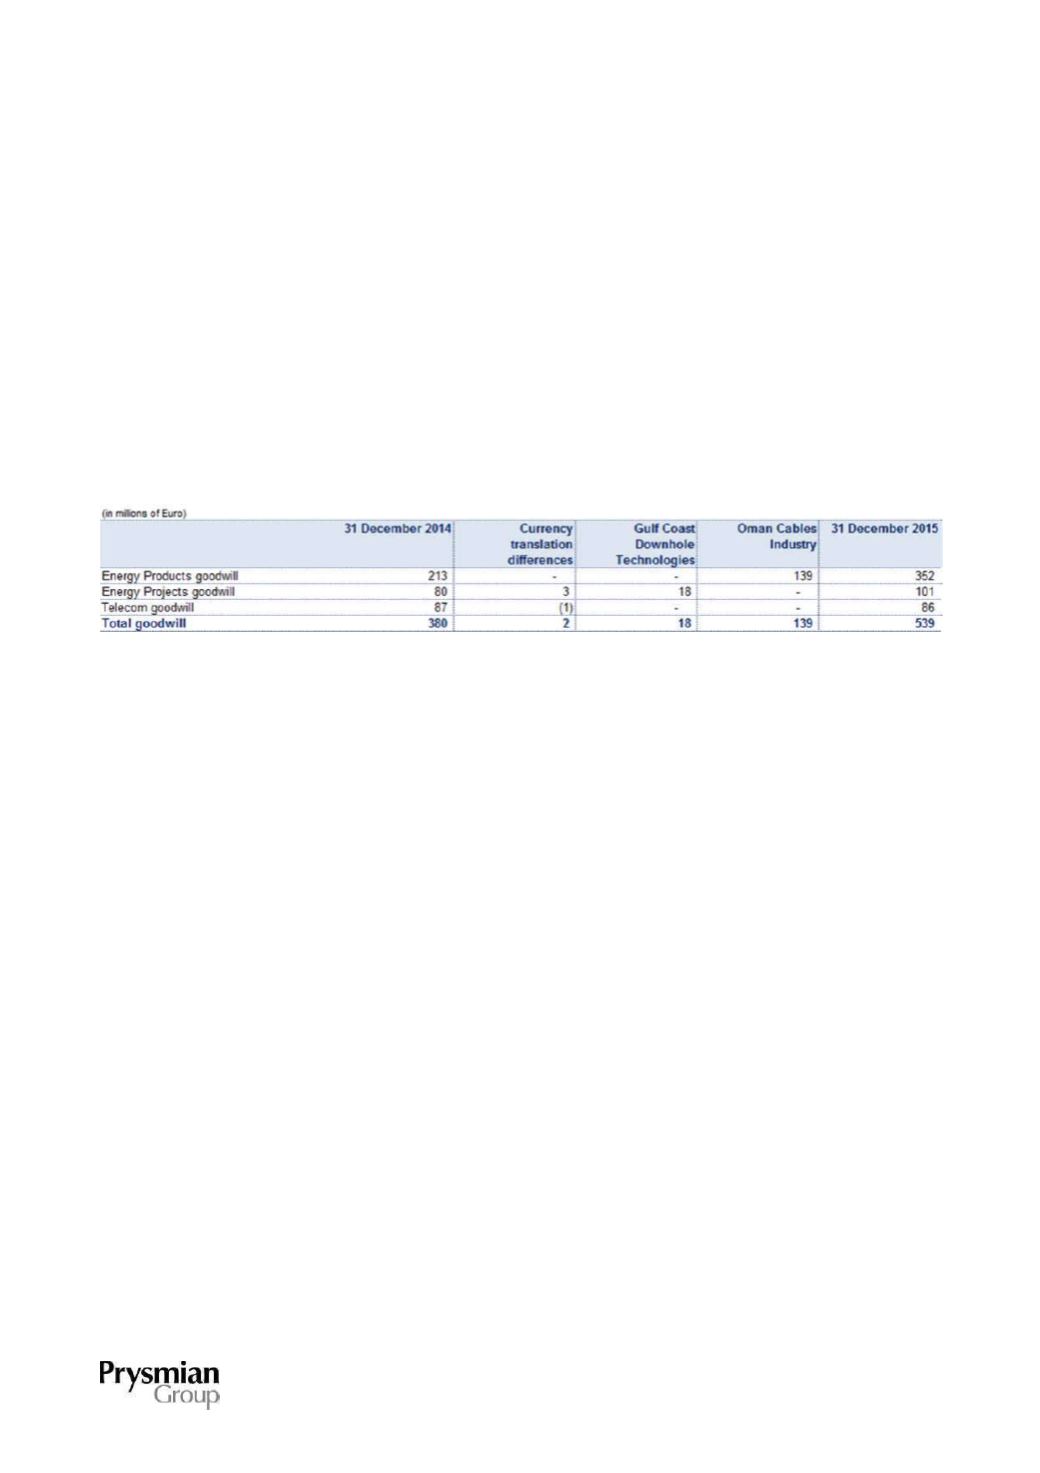
The following table reports the amount of goodwill allocated to each operating segment:
Forecast cash flows have been calculated using the post-tax cash flows expected by management for 2016,
projected on the basis of results achieved in previous years and the outlook for the markets concerned. The
operating segment cash flow forecasts have been extended to the period 2017-2018 assuming 3% expected
annual growth. A terminal value has been estimated to reflect CGU value after this period; this value has
been determined assuming a 2% perpetuity growth rate. The rate used to discount cash flows has been
determined on the basis of market information about the cost of money and asset-specific risks (Weighted
Average Cost of Capital, WACC). The outcome of the test has shown that the recoverable amount of the
individual CGUs is higher than their net invested capital (including the allocation of goodwill). In particular, in
percentage terms, recoverable amount exceeds carrying amount by 950% for the Energy Projects operating
segment, by 64% for the Energy Products operating segment, and by 84% for the Telecom operating
segment. It should be noted that the discount rate at which recoverable amount is equal to carrying amount
is 61.2% for the Energy Projects operating segment, 10.7% for the Energy Products operating segment and
12.6% for the Telecom operating segment (compared with a WACC of 7.4% used for all three operating
segments), while, in order to determine the same match for growth rates, the growth rate would have to be
negative for all segments.


