


 125 348

125
Note
2014
of which
2013 (*)
of which
related parties
related parties
(Note 33)
(Note 33)
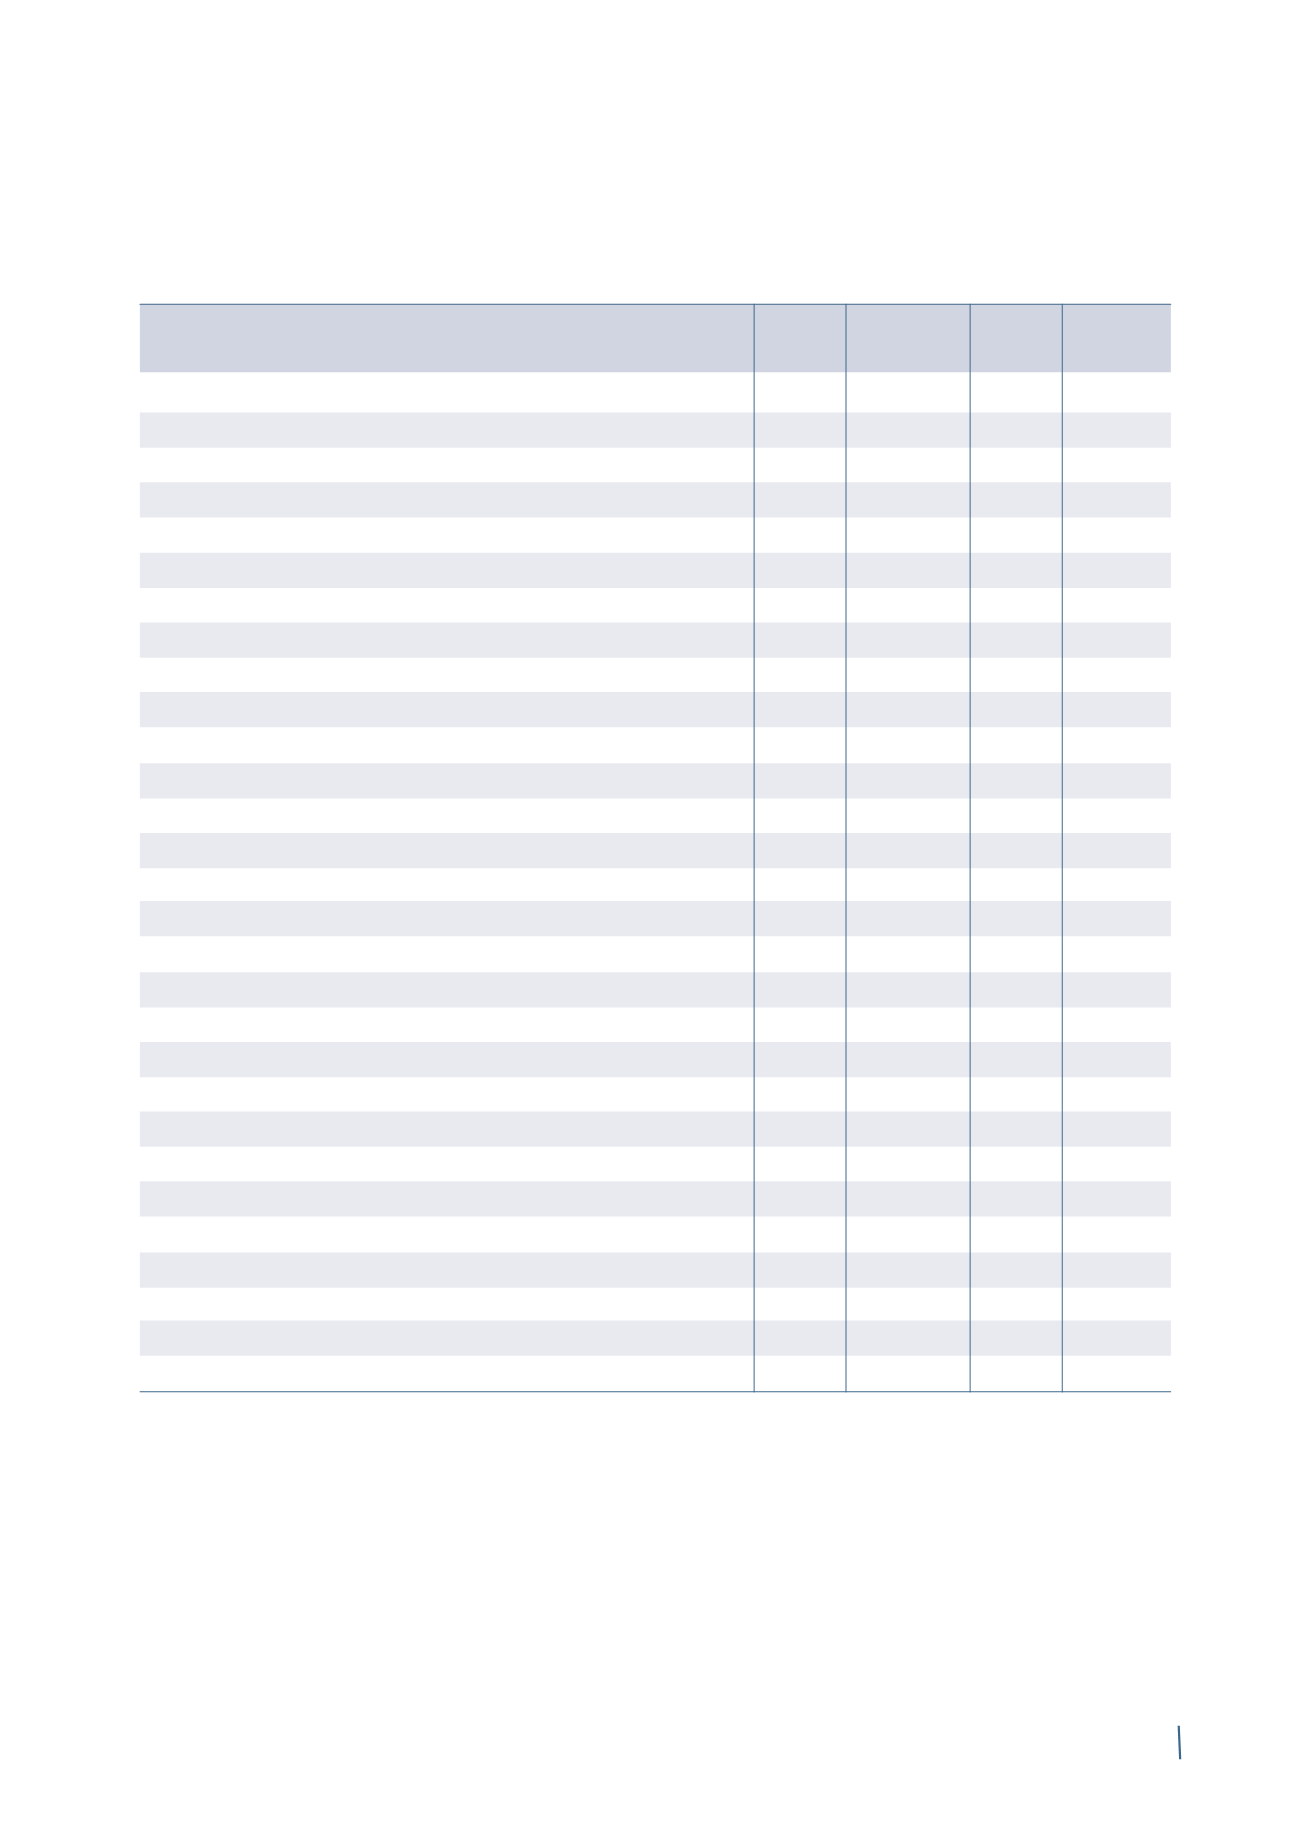
Sales of goods and services
17
6,840
43
6,995
52
Change in inventories of work in progress, semi-finished and finished goods
18
28
28
Other income
19
113
3
62
6
of which non-recurring other income
36
37
10
Raw materials, consumables used and goods for resale
20
(4,303)
(20)
(4,368)
(12)
Fair value change in metal derivatives
7
(8)
Personnel costs
21
(948)
(6)
(945)
(16)
of which non-recurring personnel costs
36
(52)
(34)
of which personnel costs for stock option fair value
(3)
(14)
Amortisation, depreciation, impairment and impairment reversal
22
(188)
(173)
of which non-recurring impairment and impairment reversal
36
(44)
(25)
Other expenses
23
(1,280)
(1)
(1,258)
(1)
of which non-recurring other expenses and releases
36
2
(26)
Share of net profit/(loss) of equity-accounted companies
24
43
43
35
35
Operating income
312
368
Finance costs
25
(479)
(435)
of which non-recurring finance costs
36
(18)
(22)
Finance income
26
339
285
of which non-recurring finance income
36
4
-
Dividens from other companies
-
-
Profit/(loss) before taxes
172
218
Taxes
27
(57)
(65)
Net profit/(loss) for the year
115
153
Attributable to:
Owners of the parent
115
149
Non-controlling interests
-
4
Basic earnings/(loss) per share (in Euro)
28
0.54
0.71
Diluted earnings/(loss) per share (in Euro))
28
0.54
0.71
(*) The previously published prior year comparative figures have been restated following the introduction of IFRS 10 and IFRS 11 and a new method of classifying
the share of net profit/(loss) of associates and joint ventures. Further details can be found in Section C. Restatement of comparative figures.
CONSOLIDATED INCOME STATEMENT
(in millions of Euro)