


 68 348

Consolidated Financial Report |
DIRECTORS’ REPORT
2014 Annual Report
Prysmian Group
68
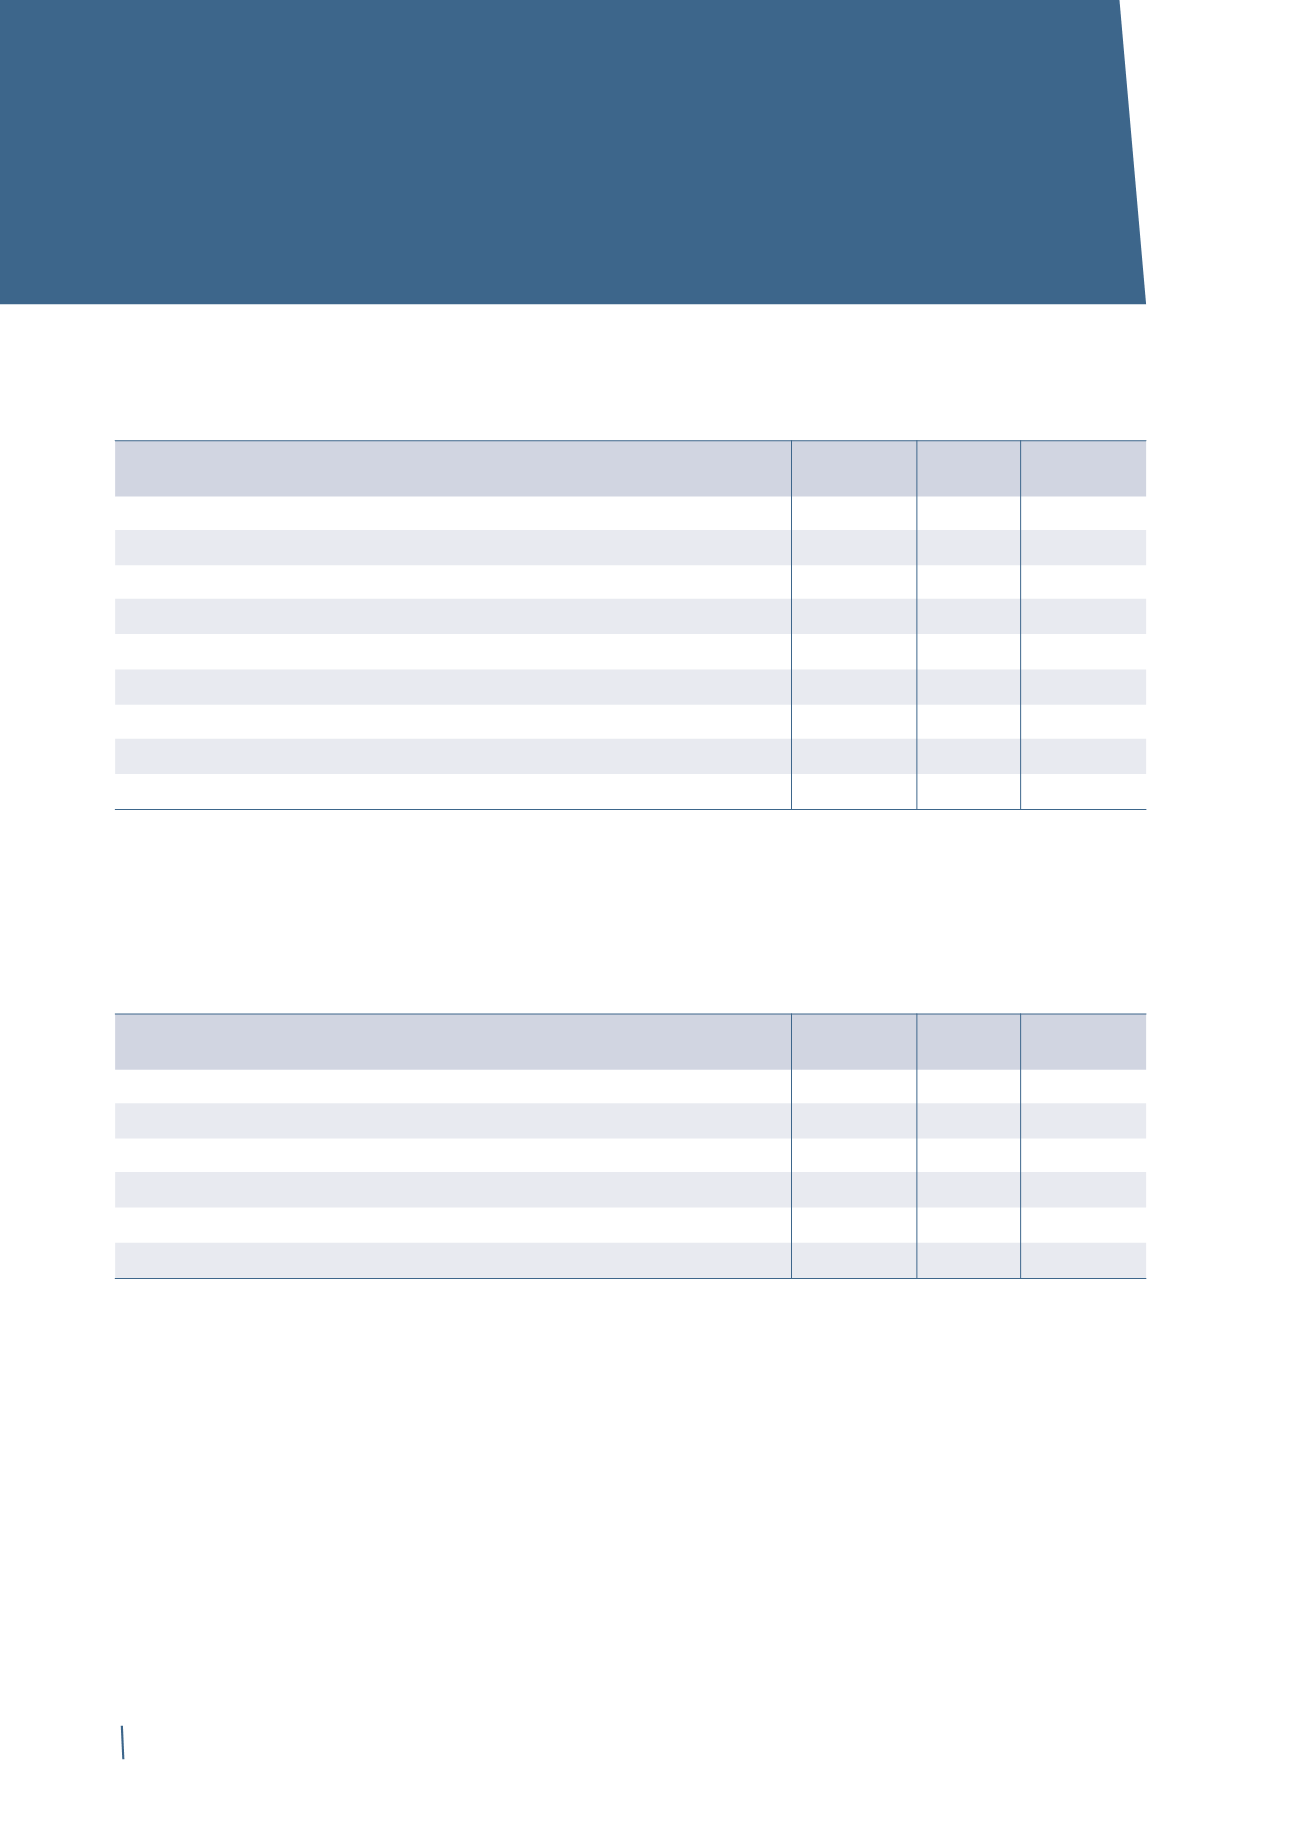
GROUP STATEMENT
OF FINANCIAL POSITION
31 December
31 December
Change 31 December
2014
2013 (*)
2012 (*)
Net fixed assets
2,219
2,207
12
2,301
Net working capital
407
386
21
433
Provisions
(281)
(297)
16
(355)
Net capital employed
2,345
2,296
49
2,379
Employee benefit obligations
360
308
52
344
Total equity
1,183
1,183
-
1,147
of which attributable to non-controlling interests
33
36
(3)
35
Net financial position
802
805
(3)
888
Total equity and sources of funds
2,345
2,296
49
2,379
31 December
31 December
Change 31 December
2014
2013 (*)
2012 (*)
Property, plant and equipment
1,414
1,390
24
1,484
Intangible assets
561
588
(27)
608
Equity-accounted investments
225
205
20
193
Available-for-sale financial assets
12
12
-
12
Assets held for sale
7
12
(5)
4
Net fixed assets
2,219
2,207
12
2,301
(*) The previously published prior year comparative figures have been restated following the introduction of IFRS 10 and IFRS 11.
RECLASSIFIED STATEMENT OF FINANCIAL POSITION
(*) The previously published prior year comparative figures have been restated following the introduction of IFRS 10 and IFRS 11.
NET FIXED ASSETS
Net fixed assets amounted to Euro 2,219 million at 31
December 2014, compared with Euro 2,207 million at 31
December 2013, posting an increase of Euro 12 million mainly
due to the combined effect of the following factors:
• Euro 163 million in investments in property, plant and
equipment and intangible assets;
• Euro 188 million in depreciation, amortisation and impair-
ment charges and reversals for the year;
• Euro 20 million for the net increase in equity-accounted
investments. This increase mainly consists of Euro 43
million for the share of net profit/(loss) of equity-account-
ed companies, net of Euro 36 million in dividend receipts,
and Euro 8 million as the positive effect of the share
dilution relating to Yangtze Optical Fibre and Cable Joint
Stock Limited Company;
• Euro 6 million in disposals of assets held for sale;
• Euro 24million in positive currency translation differences.
(in millions of Euro)
(in millions of Euro)