
29
US
27%
UK
18%
Italy
16%
France
11%
Ireland
5%
Norway
4%
Netherlands
4%
Germany
3%
Rest of Europe
6%
Hong Kong / China
3%
Rest of the world
3%
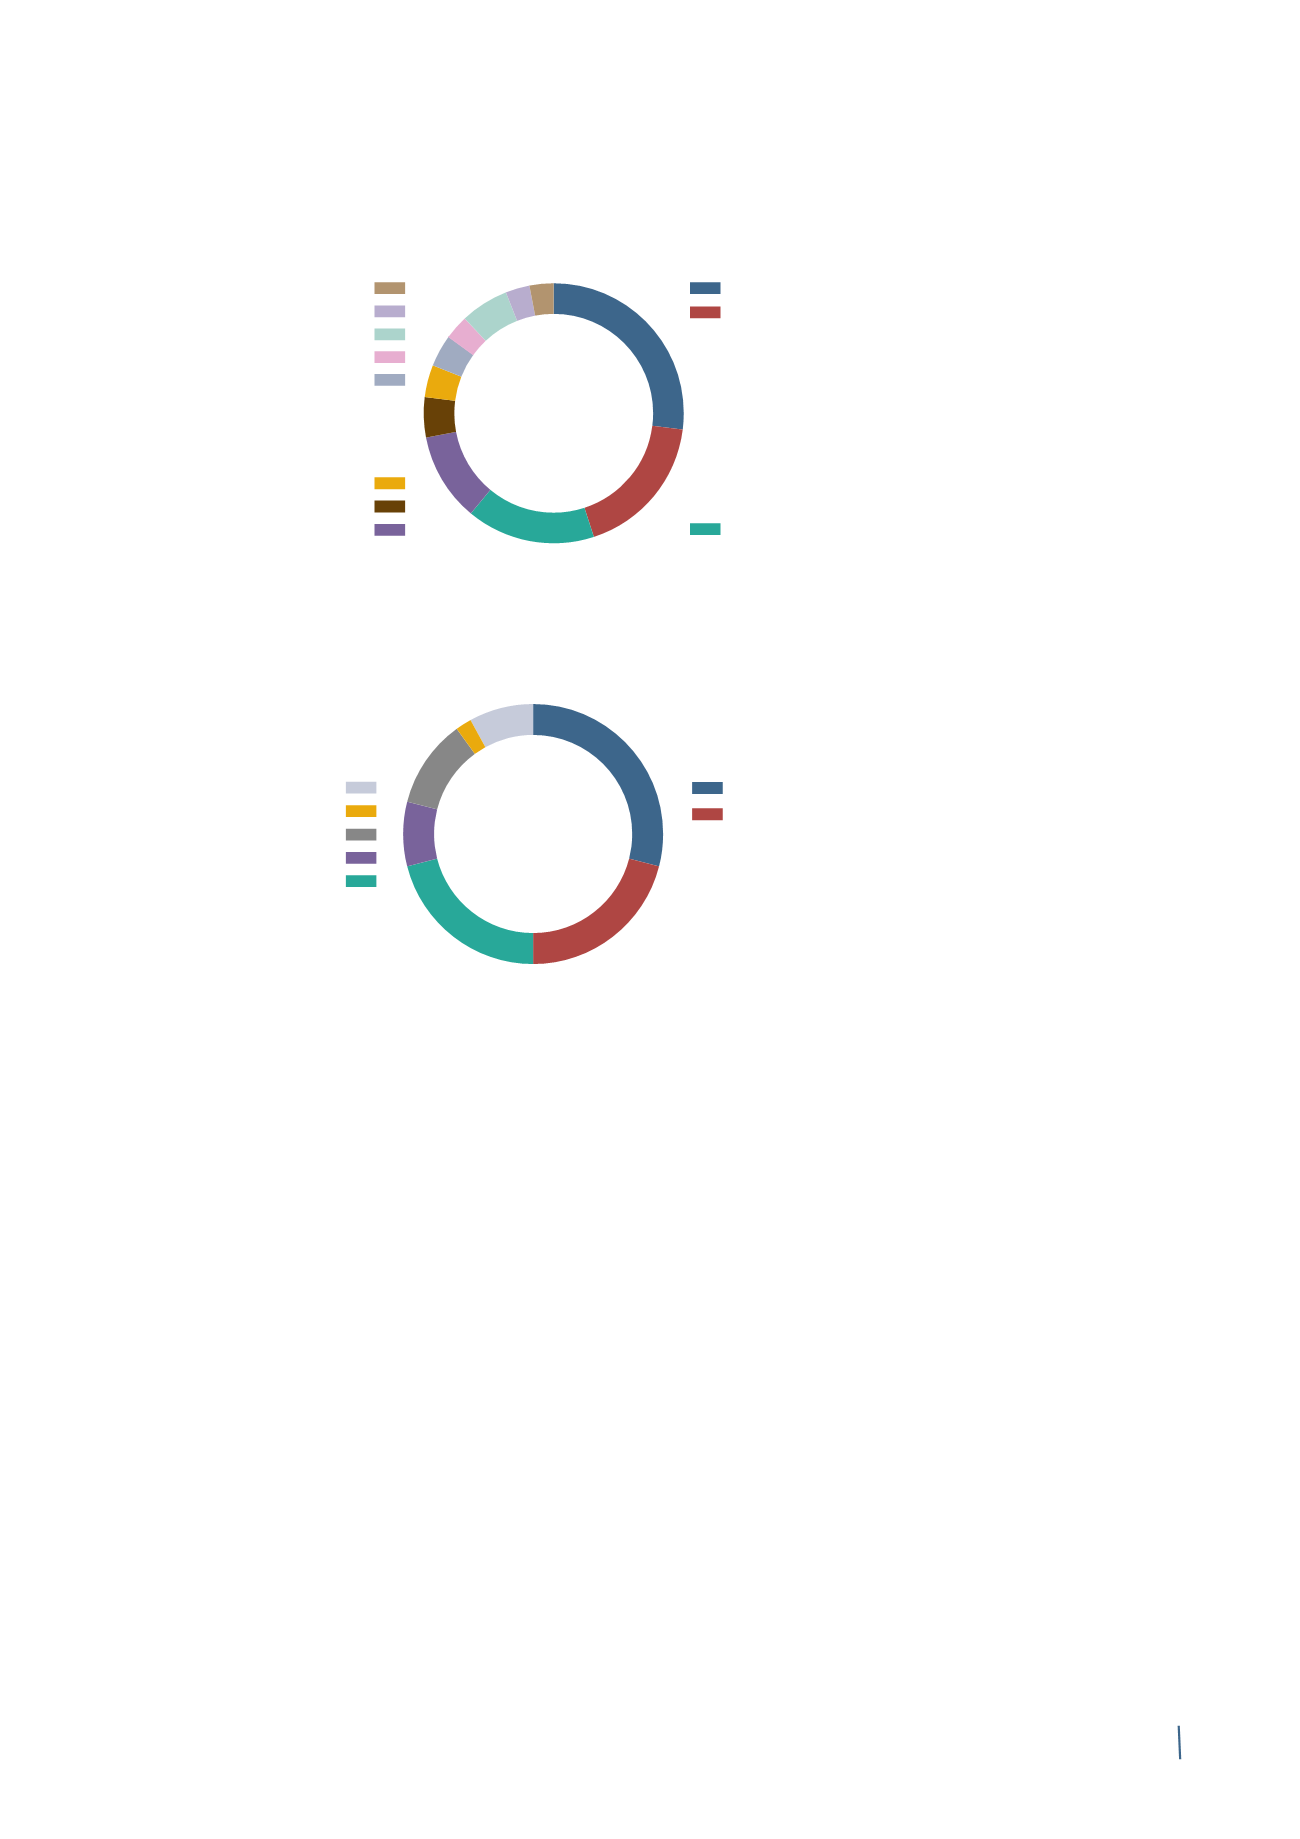
INSTITUTIONAL INVESTORS BY GEOGRAPHICAL AREA
INSTITUTIONAL INVESTORS BY INVESTMENT APPROACH
Growth
29%
GARP
21%
Index
11%
Private Equity
8%
Value
21%
Hedge Fund
2%
Other
8%
The ownership structure by geographical area confirms the
predominant presence of US and British investors, who at
the end of 2014 accounted for around 45% of the capital
held by institutional investors. They were followed by Italian
institutional investors with 16% and by the French with 11%,
both higher than the previous year. The proportion of Asian
investors was stable.
Approximately 71% of the share capital held by institutional
investors is represented by investment funds with Value,
Growth or GARP strategies, therefore focused on a medium
to long-term investment horizon. The proportion of investors
adopting an Index investment strategy, based on the principal
stock indexes, was stable compared with the prior year as was
the share of Private Equity fund investors, represented by a
single Italian fund with a long-term investment horizon and
one of the Company's shareholders for several years.
Source: Nasdaq OMX


