39
PERFORMANCE OF PRYSMIAN STOCK SINCE IPO
May 2nd-07
Jul 31st-07
Oct 29th-07
Jan 29th-08
Apr 29th-08
Jul 28th-08
Oct 24th-08
Jan 26th-09
Apr 24th-09
Jul 23rd-09
Oct 21st-09
Jan 20th-10
Apr 20th-10
Jul 19th-10
Oct 15th-10
Jan 13th-11
Apr 13th-11
Jul 12th-11
Oct 10th-11
Jan 6th-12
Apr 5th-12
Jul 4th-12
Oct 2nd-12
Dec 31st-12
Mar 29th-13
Jun 27th-13
Sept 25th-13
Dec 24th-13
Volume - Mln shares
Price - Euro
23
20
17
14
11
8
5
6.0
5.0
4.0
3.0
2.0
1.0
0
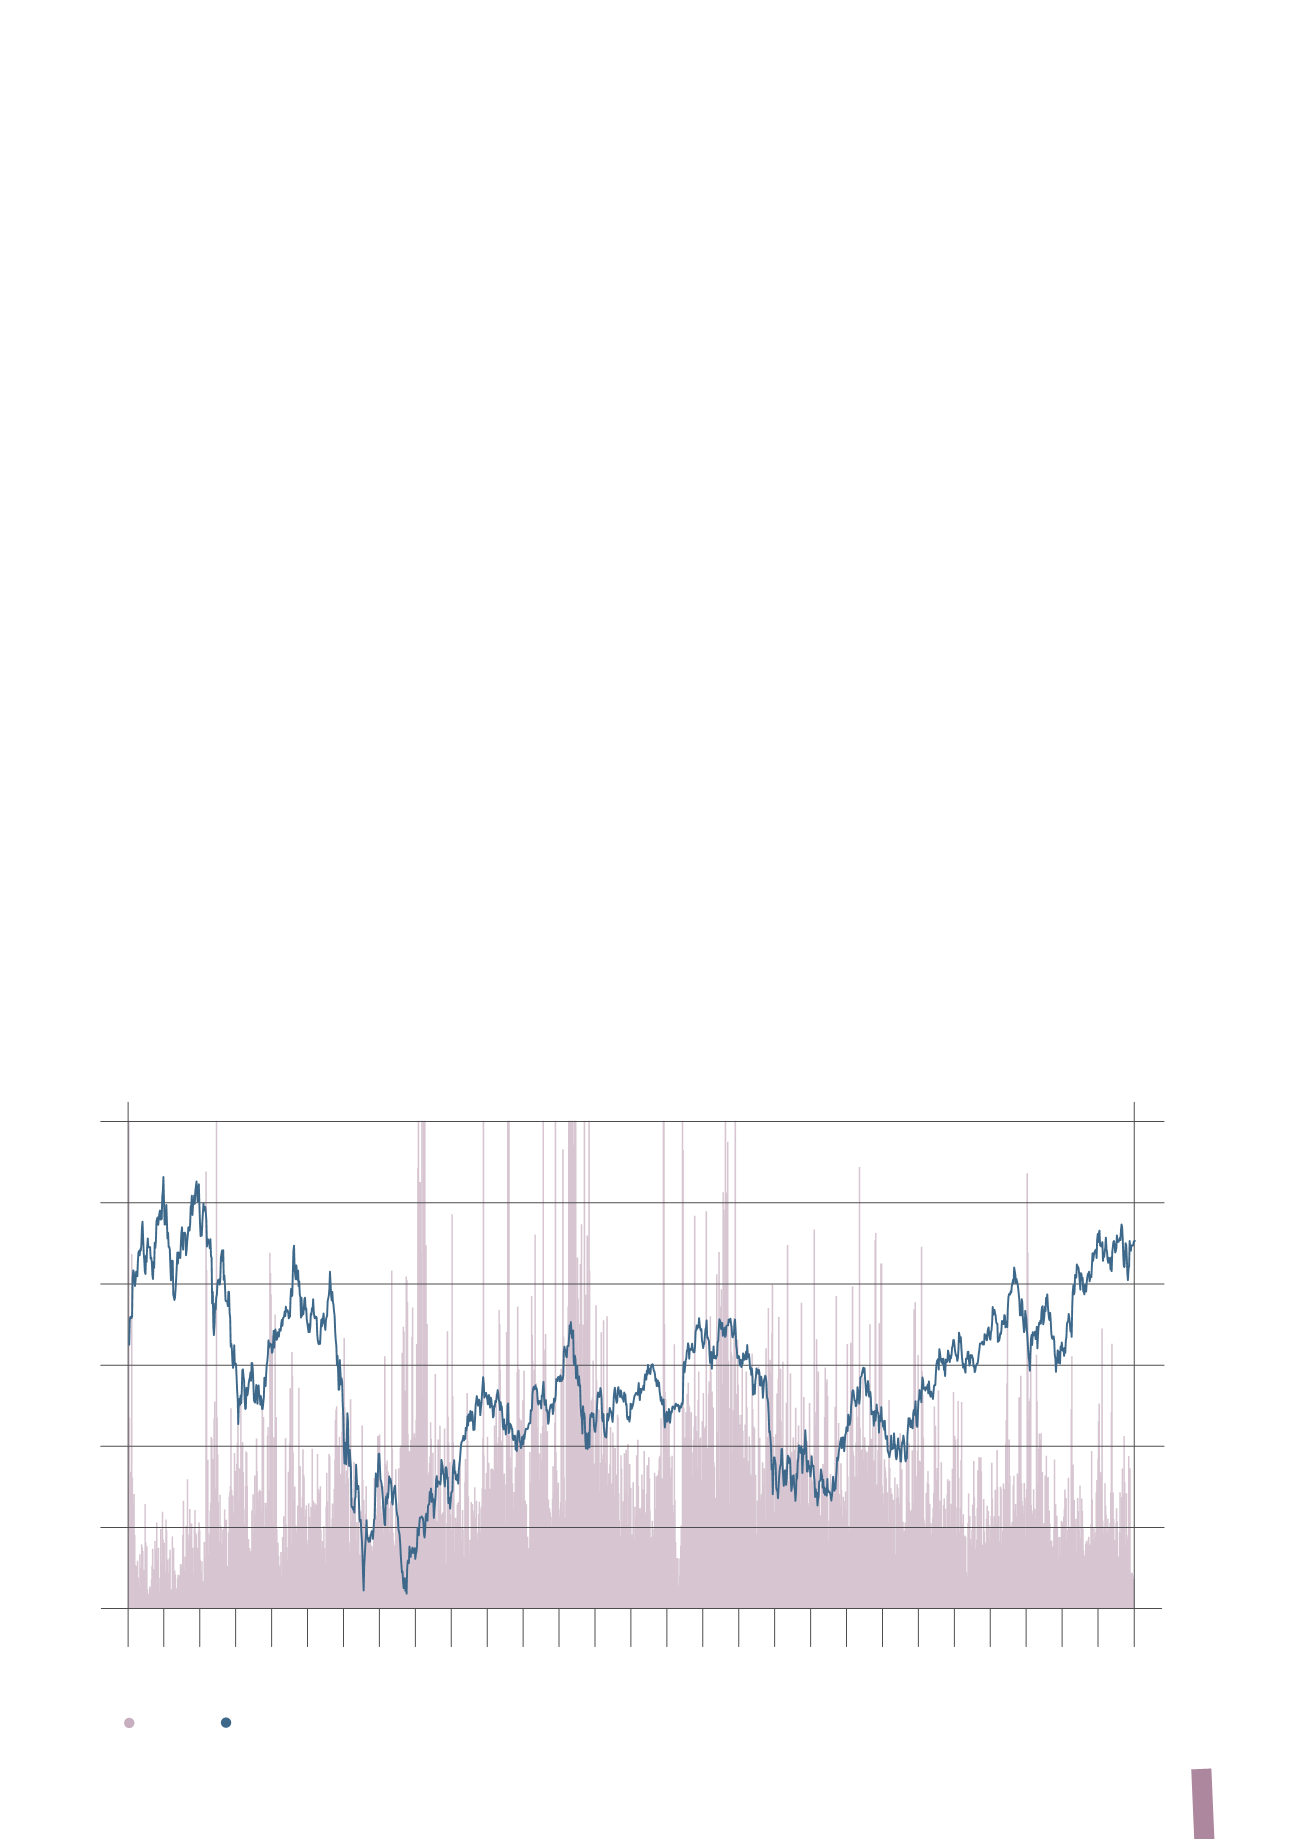
PERFORMANCE OF PRYSMIAN STOCK SINCE IPO
Volumes
Prysmian
even the European stock markets recorded an overall positive
performance: in particular, the German stock market rose by
25%, the French one by 18%, the Italian one by 17% and the
British one by 14%. Even the Spanish index, which recorded a
negative performance in 2012, was up 21%. In contrast, Asian
and emerging markets had a mixed performance: strong
progress by the Japanese stock market (+57%) and stable or
slightly positive performances in Korea (+1%) and India (+3%)
contrasted with decidedly negative performance by markets
in Brazil (-15%) and China (-13%).
In this context, the Prysmian stock increased its value by
approximately 25% over the course of 2013, rising well
above its initial listing price (Euro 15 on 3 May 2007), and
significantly outperforming its competitors and benchmark
indices, thereby increasing its weight within such indices.
The stock’s performance, including dividend pay-outs (total
shareholder return), was a gain of +27% over the course of
2013 and +38% since its listing date. The MSCI Europe Capital
Goods index reported a rise of 23% over the year and a fall of
-6% since Prysmian’s listing date, while the FTSE MIB was
up 17% from the start of the year but down -57% since the
date of the Company’s IPO. By way of reference, the principal
financial markets performed as follows in 2013: FTSE MIB
(Italy): +17%; CAC 40 (France): +18%; IBEX (Spain): +21%;
FTSE 100 (UK): +14%; DAX (Germany): +25%; Dow Jones
(US): +26%; S&P 500 (US): +30%; Nikkei (Japan): +57%; MSCI
Europe Capital Goods: +23%.
During the first quarter of 2013, the Prysmian stock steadily
strengthened in the wake of the company’s good FY 2012
results, passing the Euro 17 mark, partly mirroring the positive
trend in the major European indices. However, from the
month of March, there were fresh pressures on European
stock exchanges and sovereign debt markets following
renewed uncertainties about growth in Europe, the outcome
of the Italian general election and especially the crisis in
Cyprus, which highlighted the difficulties of coordination
between European and national authorities. The Prysmian
stock was affected by the bearish trend, falling in April
back to its level at the start of the year. In May and June,
global financial markets reflected the emergence of investor
uncertainty about the future duration of the quantitative
easing policy in the United States and the spread of concerns
about the credit outlook in China; in this high volatility period,
the stock reached its low for 2013 of Euro 14. Starting from
July, conditions in international financial markets and the
Eurozone slowly improved, thanks to a slight but steady
recovery in global economic activity and the maintenance
of expansionary monetary policies by the central banks. In
this context, the Prysmian stock entered a bullish phase,
supported by the improvement in its quarterly results
and the positive recommendations of financial analysts,
outperforming all the main stock indices and returning above
the Euro 19 mark, close to its historic post-flotation high in
2007; it stabilised at this price in the last few months of the
year, eventually closing the year at Euro 18.71, up 25% from
Euro 15.01 at the end of 2012.


