2013 SuStainability RepoRt >
enviRonmental ReSponSibility
70
| pRySmian gRoup | 2013 SuStainability RepoRt
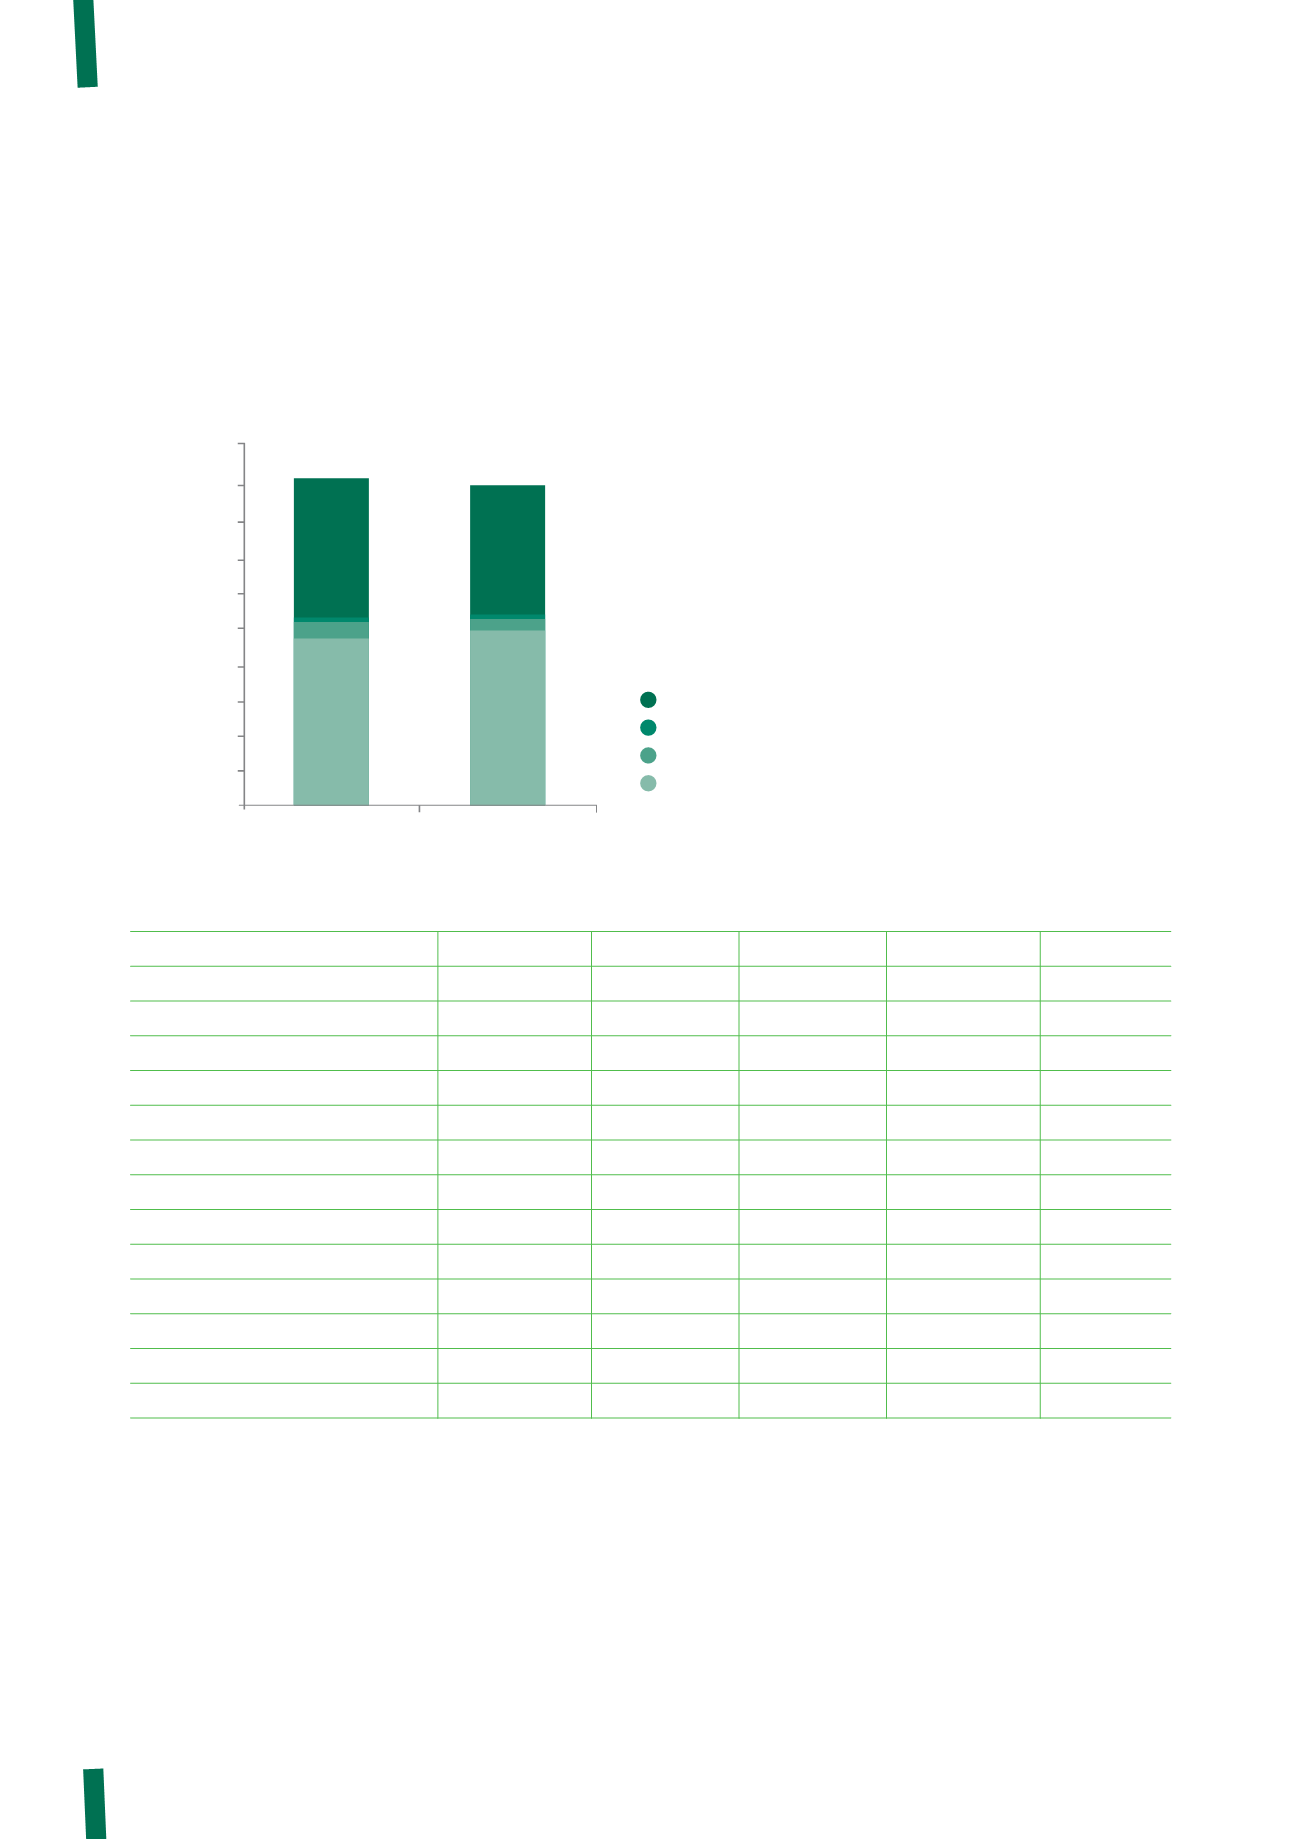
The following chart shows the total quantity of hazardous waste produced by the Group, together with the analysis by type.
HAZARDOUS WASTE
Quantity eliminated 2013 [kg]
typeS of haZaRdouS WaSte
power cables
telecom cables
accessories
optical fibre
group
Ingredients of hazardous compounds
87,526
87,526
Asbestos
15,457
189
15,646
Copper and aluminium sludge
272,938
5,917
278,855
Equipment containing PCBs
4,035
4,035
Solvents
271,734
22,772
1,937
51,536
347,979
Waste waxes and fats
26,251
29,502
55,753
Waste oil
389,014
19,516
6,647
5,733
420,910
Waste emulsions
2,417,770
270,031
2,687,801
Waste ink
13,901
3,135
17,036
Contaminated sawdust
35,656
2,695
38,351
Sludge or solid waste with solvents
9,352
9,352
Other hazardous waste
1,432,197
122,772
34,243
3,458,425
5,047,637
total
4,966,446
476,530
42,827
3,525,046
9,010,849
0
1,000,000
2,000,000
3,000,000
4,000,000
5,000,000
6,000,000
7,000,000
8,000,000
9,000,000
10,000,000
9,010,849
9,231,206
3,670,141
36,082
661,665
4,863,318
3,525,046
42,827
476,530
4,966,446
2013
2012
Prysmian Group
Prysmian Group – Waste eliminated (kg)
Optical fibre
Accessories
Telecom cables
Power cables


