2013 SuStainability RepoRt >
enviRonmental ReSponSibility
72
| pRySmian gRoup | 2013 SuStainability RepoRt
NON-HAZARDOUS WASTE
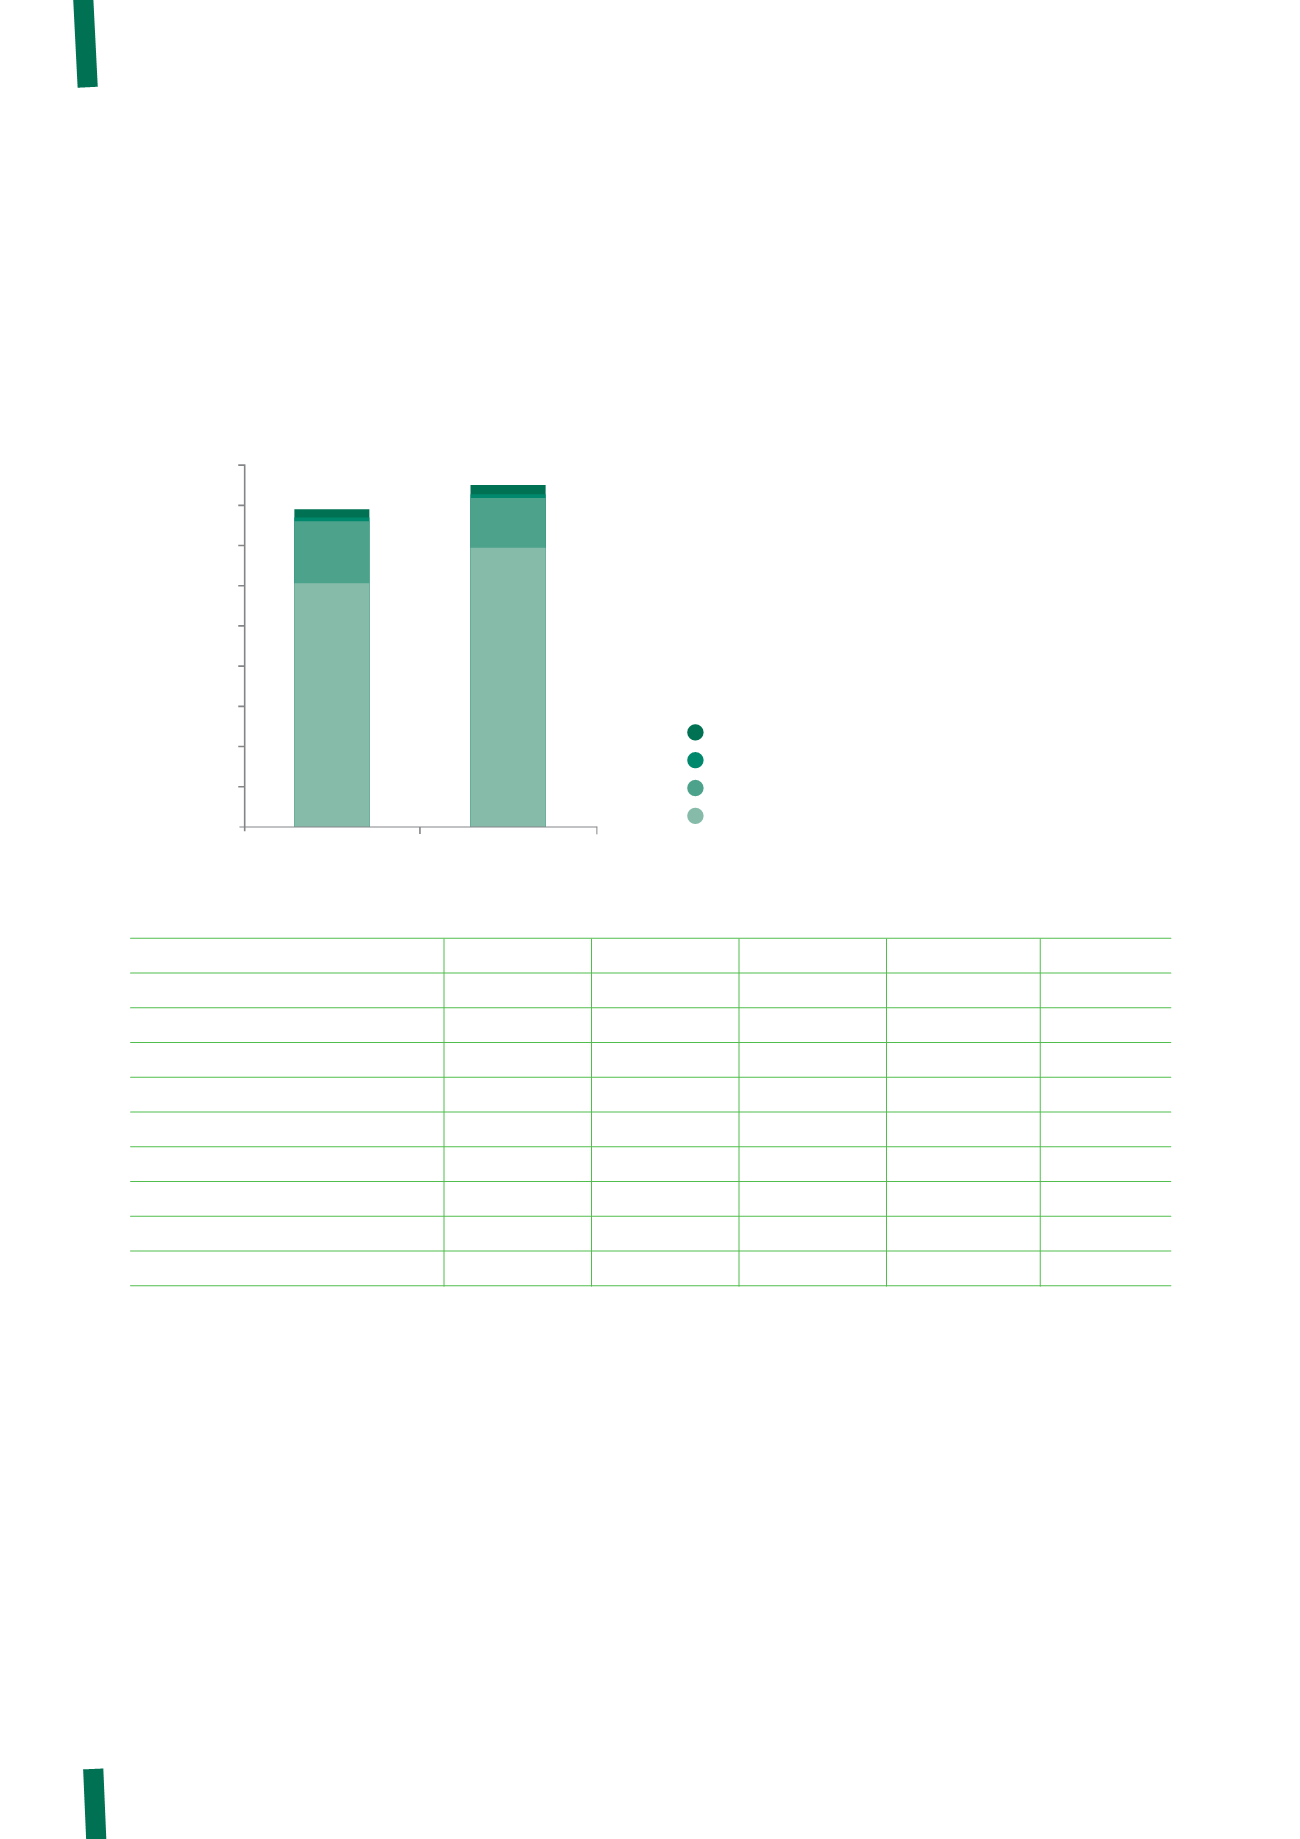
The following chart shows the total quantity of non-hazardous waste disposed of during the two years covered by this Report.
The table below provides a breakdown by caption.
85,535,116
78,062,360
0
10,000,000
20,000,000
30,000,000
40,000,000
50,000,000
60,000,000
70,000,000
80,000,000
90,000,000
2,515,140
498,598
13.482,243
61.566.379
2,529,117
1,559,035
12,043,897
69.403.067
2013
2012
Prysmian Group
Prysmian Group – Hazardous waste eliminated (kg)
Optical fibre
Accessories
Telecom cables
Power cables
Quantity eliminated 2013 [kg]
typeS of non-haZaRdouS WaSte
power cables
telecom Cables
accessories
optical fibre
group
Waste compounds
12,516,054
1,216,397
13,732,451
Non-hazardous packaging
10,631,912
3,594,757
260,174
567,707
15,054,550
Non-hazardous ingredients for compounds
1,027,881
1,027,881
Sludge from treatment of emissions
339,700
339,700
Sludge from cleansing of civil water
471,040
2,140
700,000
1,173,180
Sludge from cleansing of industrial water
99,230
1,900
160,000
261,130
Urban waste
9,691,828
3,142,155
238,299
581,848
13,654,130
Other non-hazardous materials
34,965,122
4,086,547
200,561
1,039,862
40,292,092
total
69,403,067
12,043,897
1,559,035
2,529,117
85,535,116


