71
The production of hazardous waste per unit of production is detailed below for the following categories: energy cables, telecom
cables and optical fibre.
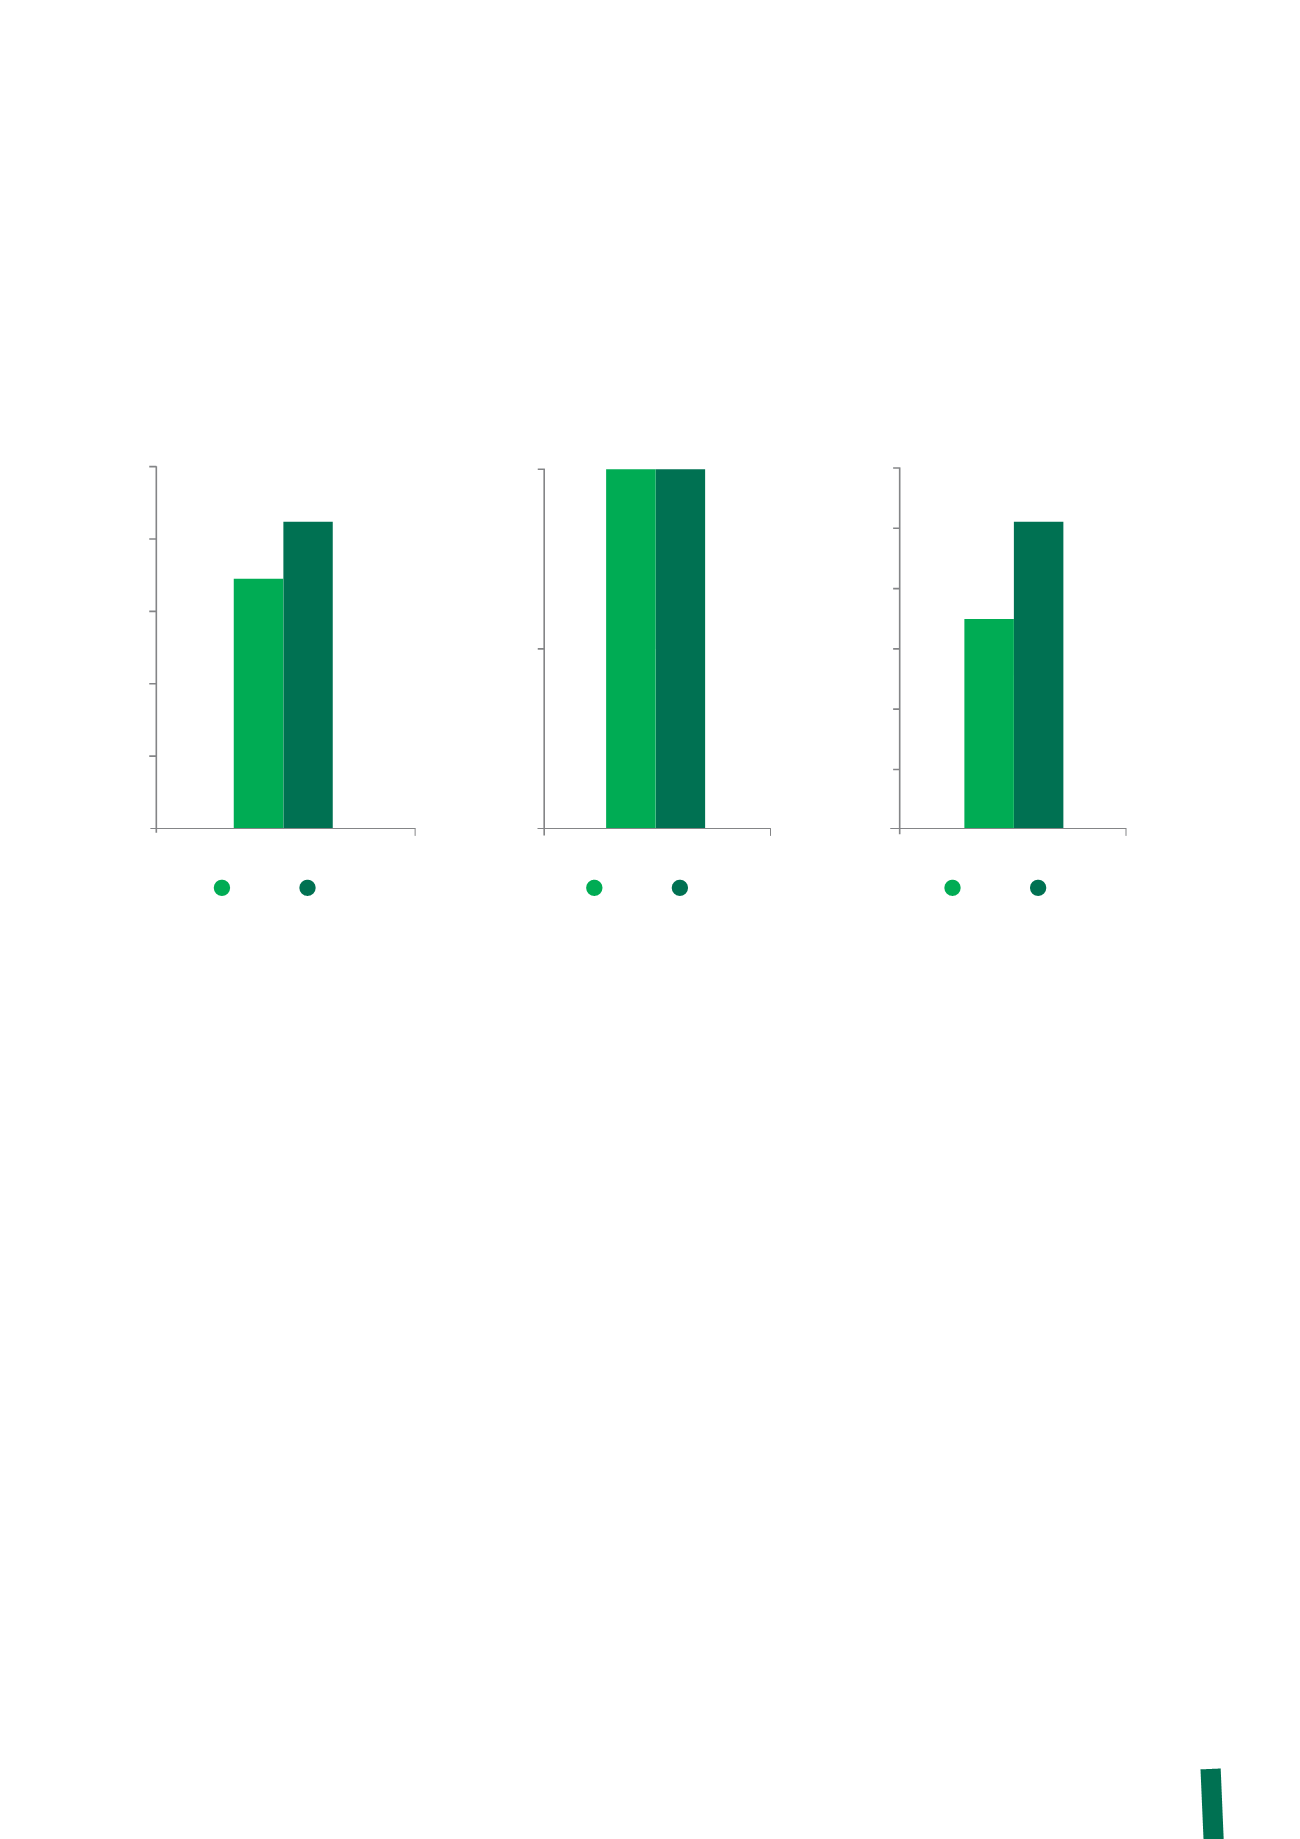
The hazardous waste produced by the power cables category
has increased slightly in absolute terms (+2%), but more
significantly per tonne of production (+13.5%).
The time interval for the cleaning of machines, which
generates waste emulsions and sludge, exceeds one year
in many cases, resulting in a slightly erratic flow of waste
disposal. In addition, it is necessary to consider:
• the different type of production resulting, in some cases,
in the use of a greater quantity of solvents and, in others,
in the need to clean the drawing lines in preparation for
processing a different material;
• the “one-off” elimination of equipment;
• greater use of the drawing lines, resulting in faster
consumption of the emulsions;
• the emptying of a fuel tank (which is not normally emptied);
• non-routine maintenance in order to repair sections of
processing lines, resulting in a spike in the generation of
hazardous waste at some factories.
In addition, production ceased at the Eschweiler and Fercable
(3) The unit of production data for 2012 and 2013 is not compatible for the optical fibre category, since the method of calculating total production has changed.
factories during 2013. In 2012, these locations had generated
a markedly lower than average quantity of hazardous waste
per unit of production, compared with the other factories that
produce power cables.
Lastly, significant improvements have been made at the
Vila Velha factory in Brazil, where the quantity of ethylene
glycol to be eliminated has been reduced by implementing an
appropriate system for the treatment of waste waters.
Telecom cables generated less hazardous waste, both in
absolute terms (-28%) and per km of production (-14%). This
was partially due to a lack of uniformity in the frequency
of eliminating this type of waste; indeed, the interval can
be years in many cases (many factories eliminated large
quantities in 2012). Other factors include the closure of
the Livorno Ferraris factory and fluctuations in the mix of
production, which generate different quantities of hazardous
waste.
The total amount of hazardous waste generated by the optical
fibre category during 2013 was 4% lower than in 2012.
5
4
3
2
1
0
4.09
Power Cables
Hazardous waste disposed
per tonne of product (kg/t)
3.60
2012
2013
0.02
0.00
0.010
0.02
0.02
Telecom Cables
Hazardous waste disposed
per kilometer of product (kg/t)
2012
2013
0.11
0.00
0.02
0.04
0.06
0.10
0.08
0.12
0.07
Hazardous waste disposed
per kilometer of product (kg/km)
3
2012
2013
Optical fibre


