73
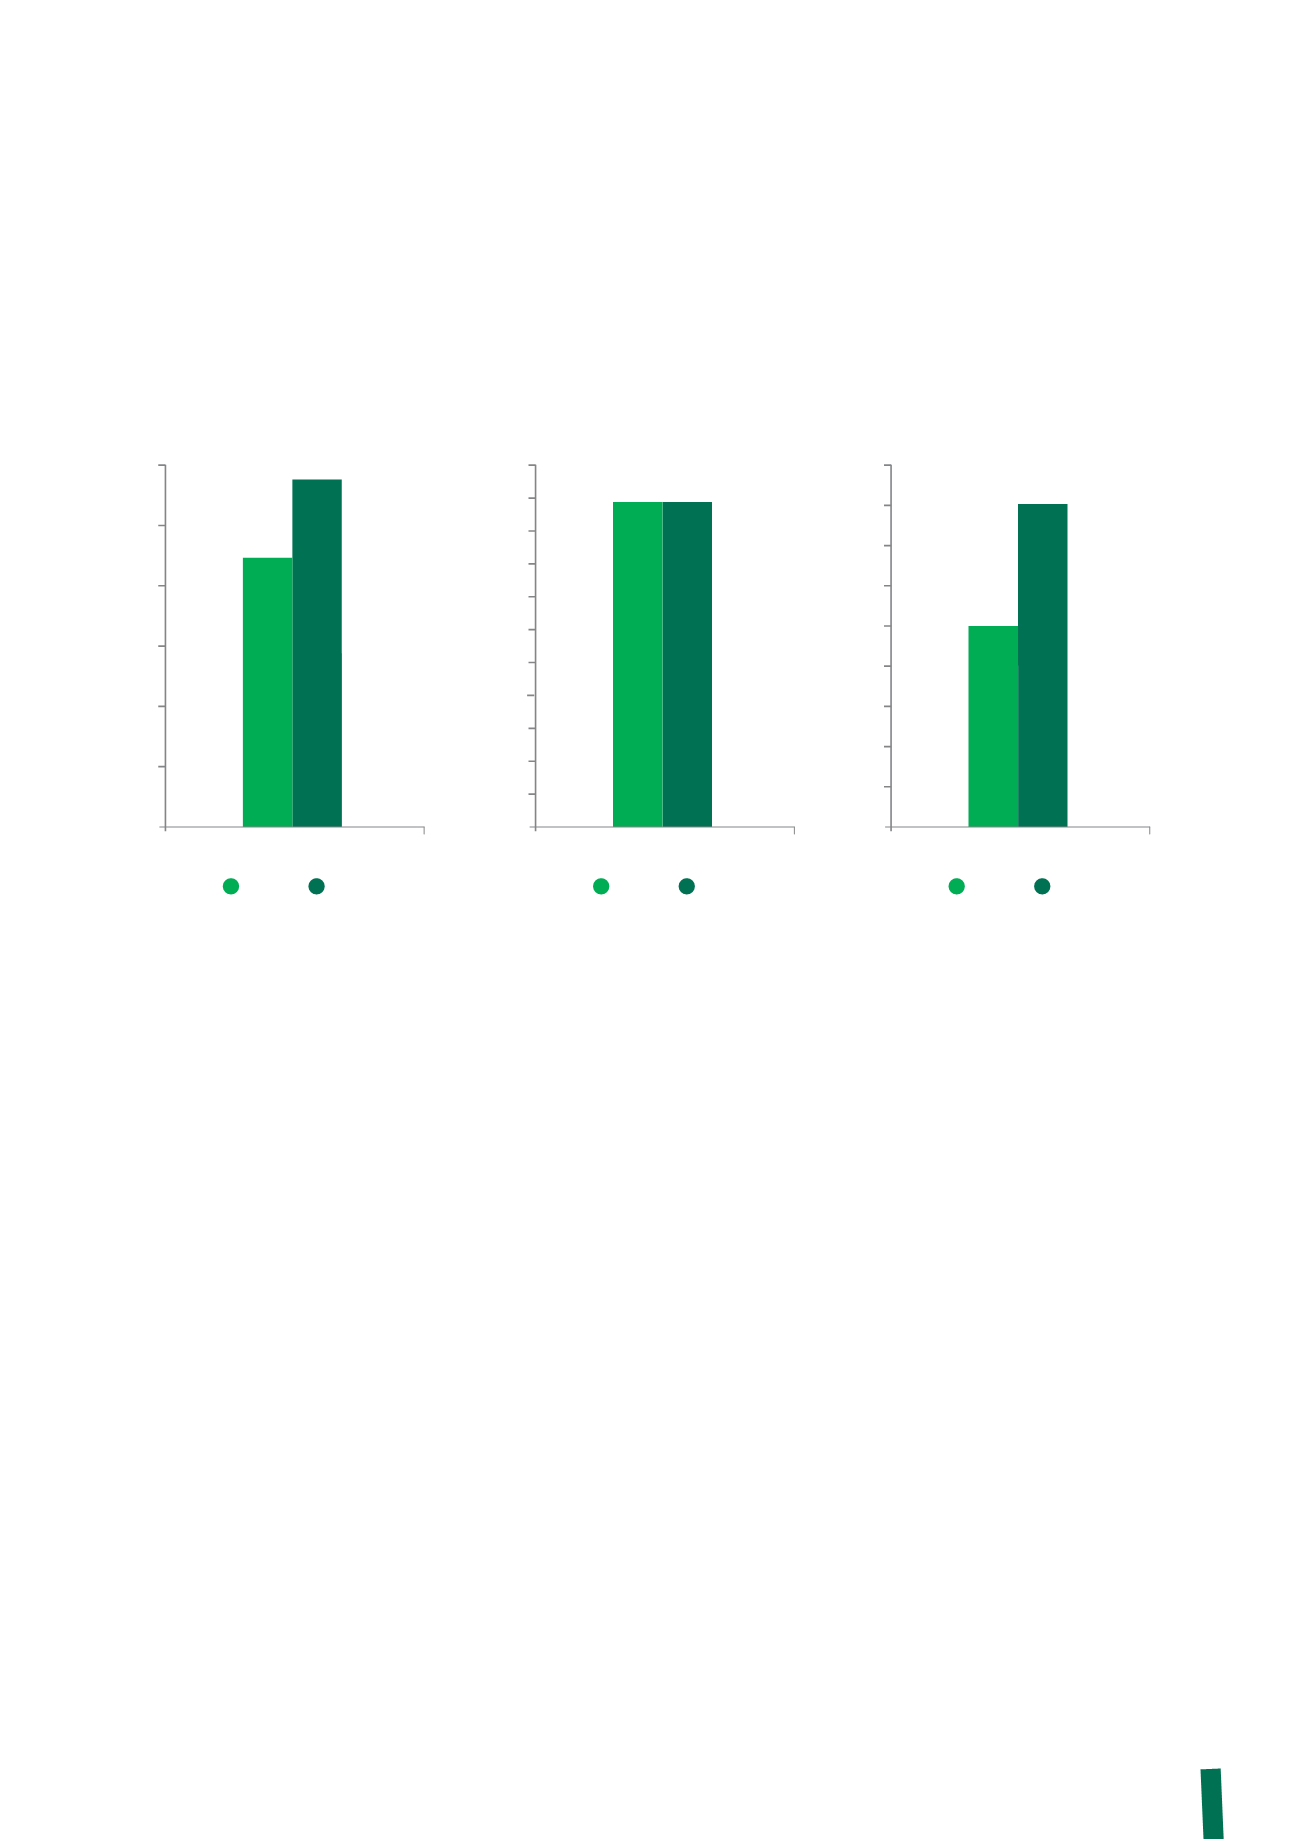
The production of non-hazardous waste per unit of production is detailed below for the following categories: energy cables,
telecom cables and optical fibre.
(4) The unit of production data for 2012 and 2013 is not compatible for the optical fibre category, since the method of calculating total production has changed.
There was an increase in the quantity of non-hazardous waste
eliminated in 2013 with respect to 2012, both in absolute terms
(+13%) and per tonne of production (+25%).
The reasons for this include:
• non-routine disposal of obsolete equipment and materials
accumulated over the years;
• increases in scrap cable deriving from power supply failures
or processing problems;
• construction work carried out at one factory, resulting in an
increase in waste to be eliminated.
The principal environmental management “good practices”
implemented during 2013 were:
• reduction of waste mixture achieved, for example, at
the Vila Velha factory via the improved management of
processes;
• the re-granulation of scrap polymers - at several factories
- which not only contains the volume of waste eliminated
but also generates savings in economic terms. For example,
waste materials at the Ascoli, Giovinazzo and Merlino
factories in Italy were re-processed in part directly in-house
and in part by an external firm, following which they were
returned and used again as raw materials. The savings made
by these 3 Italian factories, in terms of not purchasing raw
materials and the absence of disposal costs, amounted to
about 100,000 Euro.
With regard to the telecom cables category, the absolute
quantity of non-hazardous waste eliminated fell by 11%, while
the volume per km of cable produced was stable.
The absolute amount of waste eliminated by the Optical fibre
category was essentially stable (+0.6%).
60
50
40
30
20
10
0
57.16
Non-hazardous waste disposed
per tonne of product (kg/t)
45.60
2012
2013
Power Cables
0.50
0.45
0.40
0.35
0.30
0.25
0.20
0.15
0.10
0.05
0.00
0.44
Non-hazardous waste disposed
per kilometer of product (kg/km)
0.44
2012
2013
Telecom Cables
0.09
0.08
0.07
0.06
0.05
0.04
0.03
0.02
0.01
0.00
0.08
Non-hazardous waste disposed
per Kilometer of product (kg/km)
4
0.05
2012
2013
Optical fibre


