2013 SuStainability RepoRt >
enviRonmental ReSponSibility
68
| pRySmian gRoup | 2013 SuStainability RepoRt
4
3
2
1
0
3.44
Power Cables
Energy Consumed
per tonne of product (GJ/t)
3.09
2012
2013
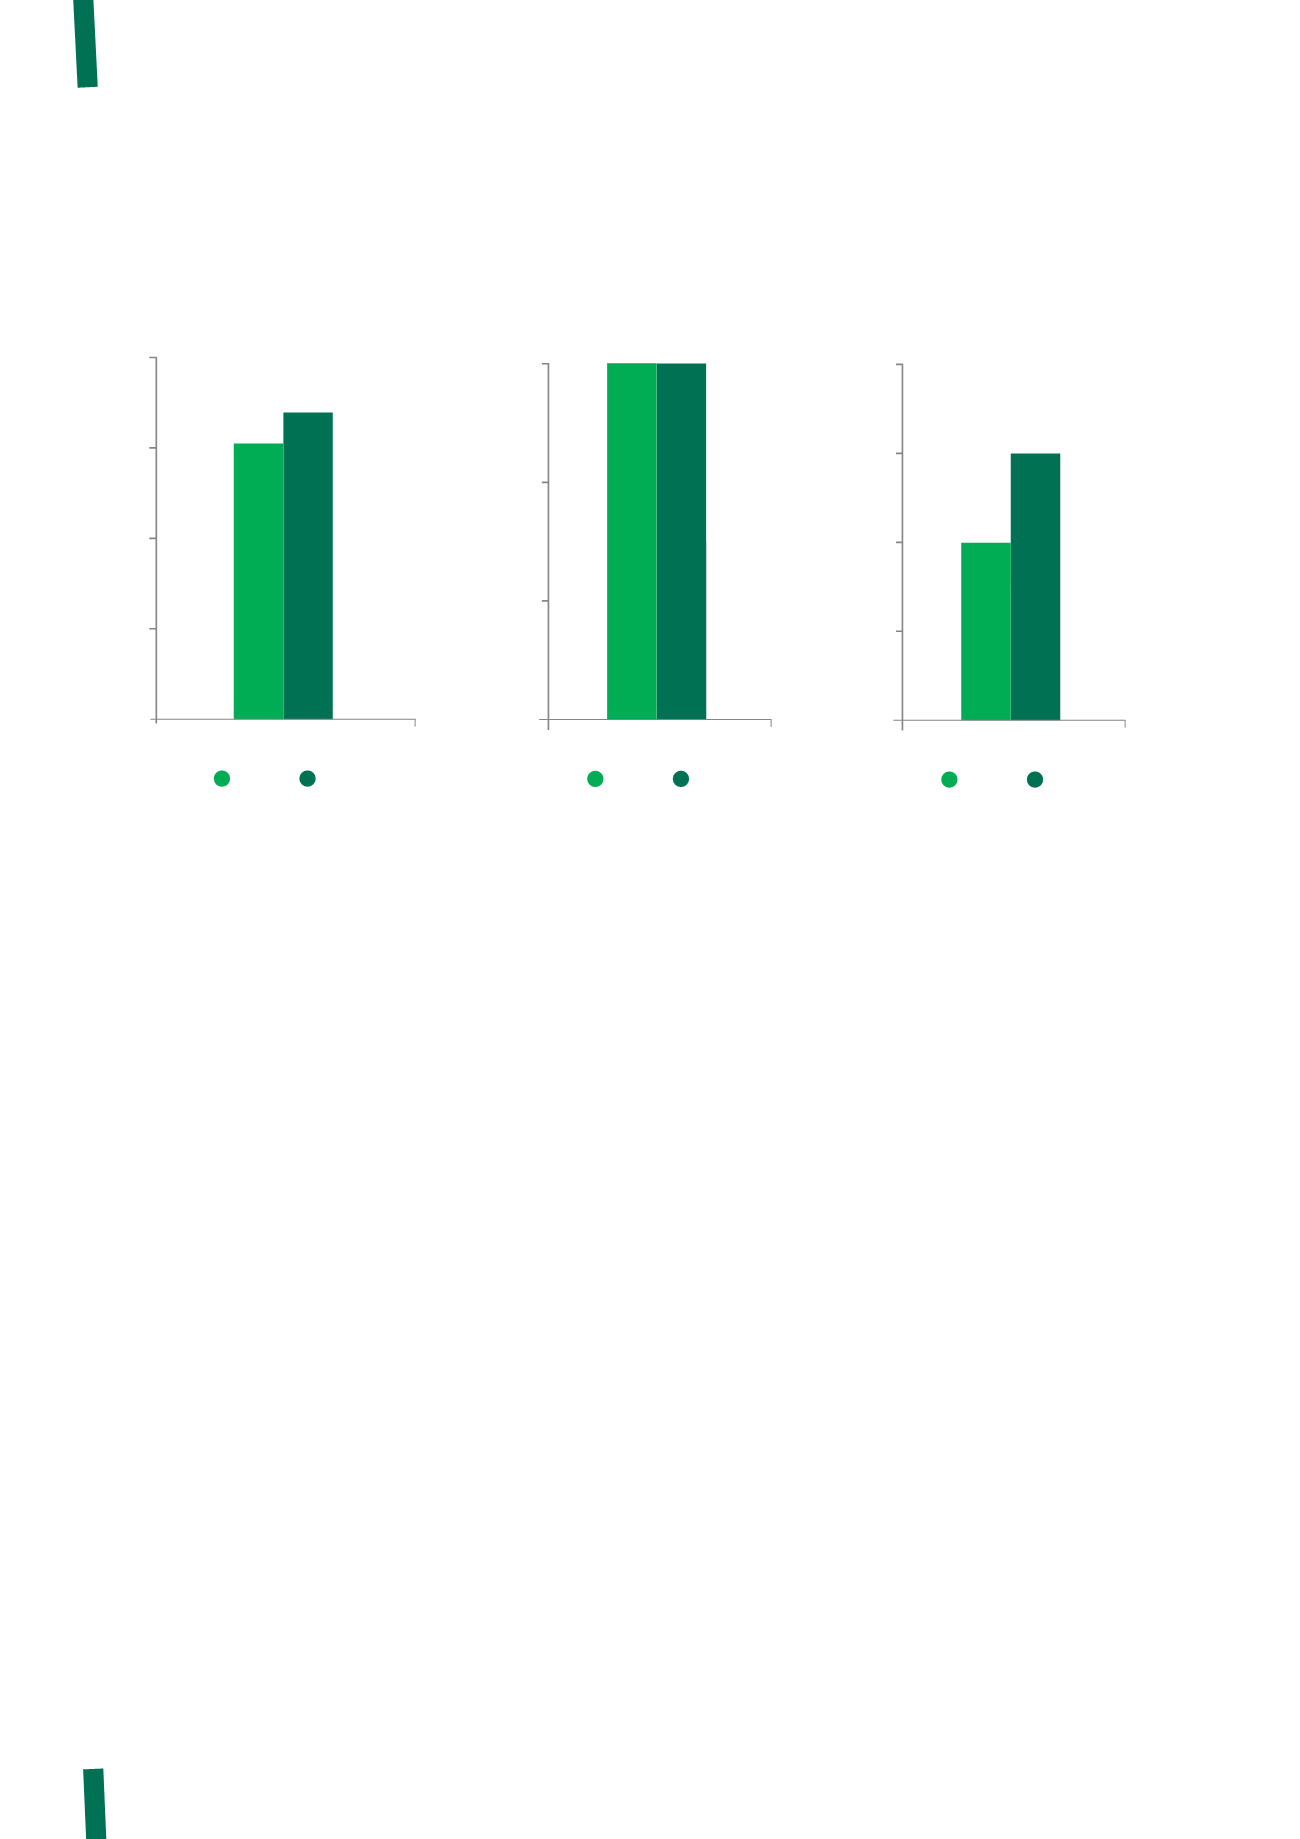
Absolute energy consumption by the power cables sector was
essentially stable, with a rise of just 0.3%, but there was an
increase of 11% per tonne of production.
This outcome was partly due to:
• changes in the product mix (both types of cable and
mixtures) that resulted in changes in the specific
consumption per unit of production;
• the construction of new buildings and the installation of
processing machinery;
• extension of the heated areas within the buildings at one
factory.
By contrast, improvements were achieved at the Melaka
factory as a result of various actions designed to optimise the
efficient use of certain equipment, such as:
• loss limitation and other work on compressed air
equipment;
• improvement in processing speeds;
• installation of LED lighting;
• efficiency improvements when working below capacity;
• modification to installations in order to centralise the
functioning of chiller and compressor circuits, thus avoiding
over usage.
(1) The unit of production data for 2012 and 2013 is not compatible for the optical fibre category, since the method of calculating total production has changed.
0.03
0.03
0.02
0.01
0.00
0.03
Telecom cables
Energy Consumed
per kilometer of product (GJ/km)
2012
2013
Energy consumption per unit of production is detailed below for the following categories: energy cables, telecom cables and
optical fibre.
0.02
0.03
0.04
0.03
0.02
0.01
0.00
Optical fibre
Energy Consumed
per kilometer of product (GJ/km)
1
2012
2013
The energy consumption of the Telecom cables category was
relatively stable in absolute terms, having risen by just 0.9%.
By contrast, consumption has increased by about 12% per km
of cable produced.
This difference in the two parameters reflects the reduction
in volumes produced by certain operating units, as well as a
change in the method used to record the volumes produced
at one of the Brazilian factories. In addition, from this year, a
number of factories now include the energy consumed by the
external services received in their total consumption of energy
(previously excluded).
The total energy consumed by the Optical fibre category was
lower than in 2012, following a reduction in absolute terms by
about 6%.


