


 168 348

Consolidated Financial Report |
EXPLANATORY NOTES
2014 Annual Report
Prysmian Group
168
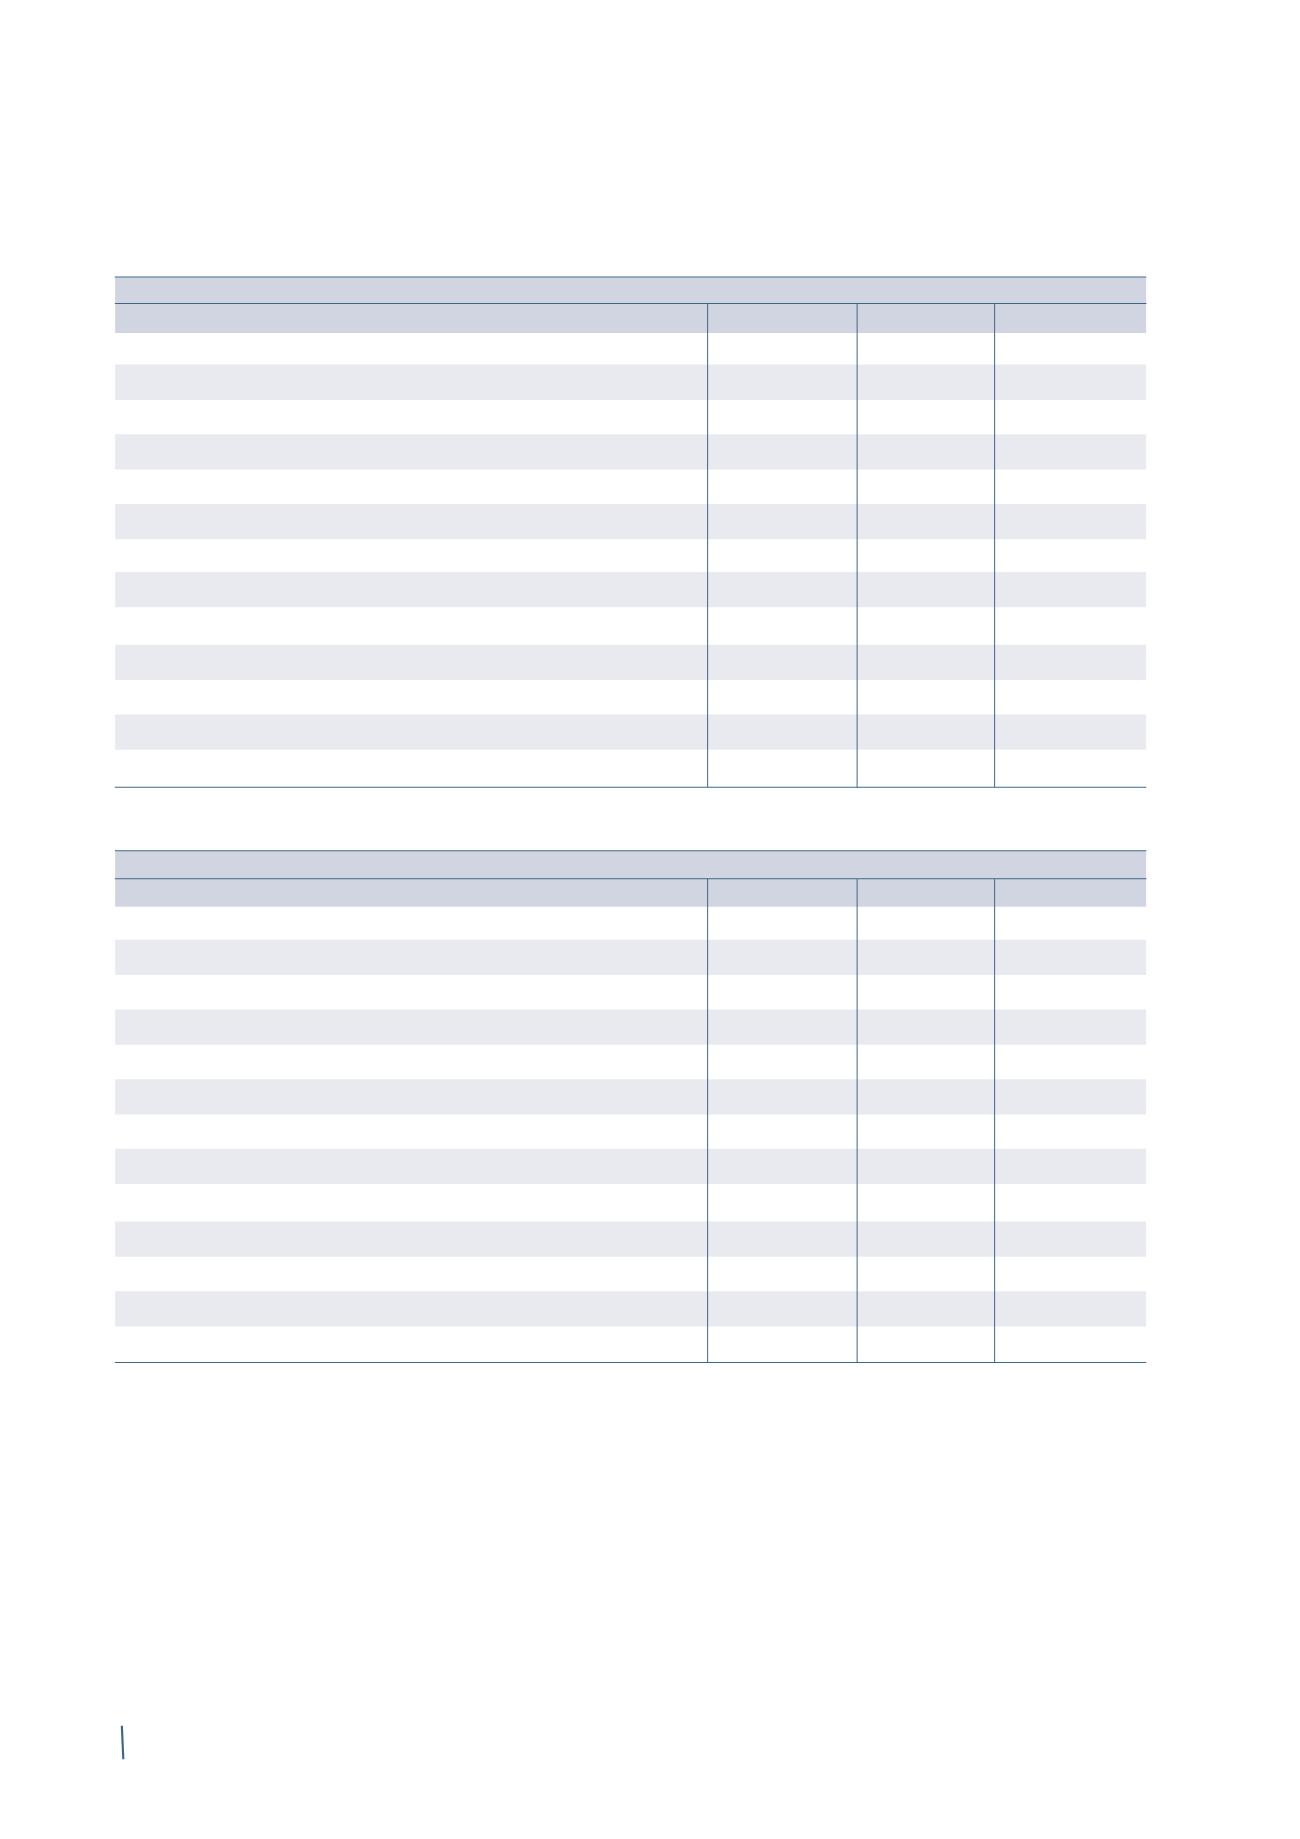
The following tables present the assets and liabilities that are measured at fair value:
31 December 2014
Level 1
Level 2
Level 3
Total
Assets
Financial assets at fair value through profit or loss:
Derivatives
-
19
-
19
Financial assets held for trading
67
9
-
76
Hedging derivatives
-
11
-
11
Available-for-sale financial assets
-
-
12
12
Total assets
67
39
12
118
Liabilities
Financial liabilities at fair value through profit or loss:
Derivatives
1
27
-
28
Hedging derivatives
-
24
-
24
Total liabilities
1
51
-
52
(*) The previously published prior year consolidated financial statements have been restated following the adoption of IFRS 10 and IFRS 11. Further details can
be found in Section C. Restatement of comparative figures.
31 December 2013 (*)
Level 1
Level 2
Level 3
Total
Assets
Financial assets at fair value through profit or loss:
Derivatives
5
15
-
20
Financial assets held for tradin
86
7
-
93
Hedging derivatives
-
5
-
5
Available-for-sale financial assets
-
-
12
12
Total assets
91
27
12
130
Liabilities
Financial liabilities at fair value through profit or loss:
Derivatives
18
18
-
36
Hedging derivatives
-
13
-
13
Total liabilities
18
31
-
49
Financial assets classified in fair value Level 3 reported no
significant movements in either 2014 or 2013.
Given the short-term nature of trade receivables and
payables, their book values, net of any allowance for doubtful
accounts, are treated as a good approximation of fair value.
During 2014 there were no transfers of financial assets
and liabilities between the different levels of the fair value
hierarchy.
(in millions of Euro)
(in millions of Euro)