


 208 348

Consolidated Financial Report |
EXPLANATORY NOTES
2014 Annual Report
Prysmian Group
208
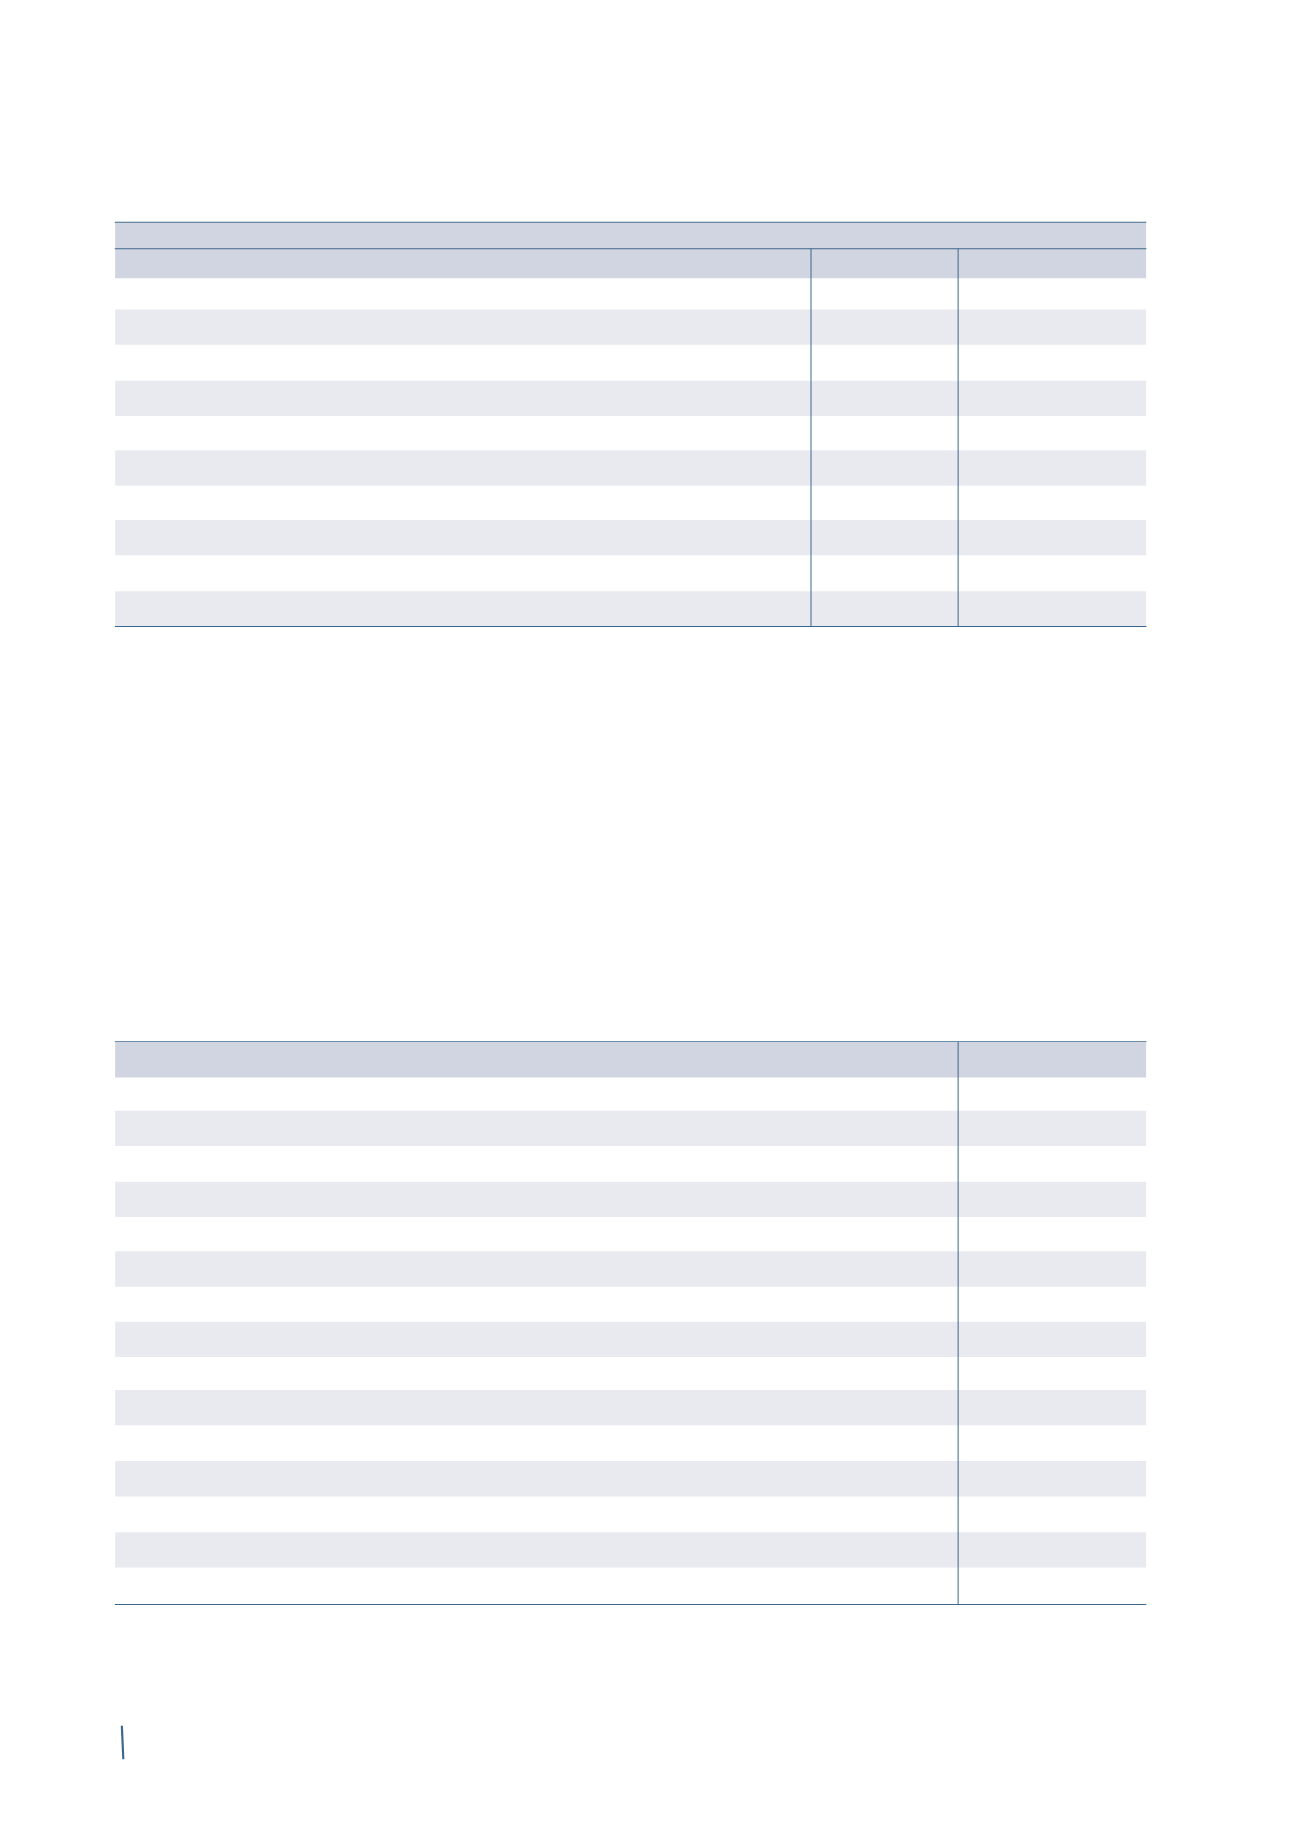
31 December 2013 (*)
Non-current
Current
Total
Trade payables
-
1,409
1,409
Total trade payables
-
1,409
1,409
Other payables:
Tax and social security payables
12
99
111
Advances from customers
-
241
241
Payables to employees
-
98
98
Accrued expenses
3
136
139
Other
5
114
119
Total other payables
20
688
708
Total
20
2,097
2,117
(*) The previously published prior year consolidated financial statements have been restated following the adoption of IFRS 10 and IFRS 11. Further details can
be found in Section C. Restatement of comparative figures.
Trade payables include around Euro 176 million (Euro 183
million at 31 December 2013) for the supply of strategic metals
(copper, aluminium and lead), whose payment terms, in some
cases, are longer than normal for this type of transaction.
Advances from customers report the liability for construction
contracts, amounting to Euro 286 million at 31 December 2014
compared with Euro 155 million at 31 December 2013. This
liability represents the gross amount by which work invoiced
exceeds costs incurred plus accumulated profits (or losses)
recognised using the percentage of completion method.
Payables to employees at 31 December 2014 have decreased
following settlement of the liability for the Long-term
incentive plan 2011-2013, amounting to Euro 36 million at 31
December 2013.
The following table breaks down trade and other payables
according to the currency in which they are expressed:
31 December 2014
31 December 2013 (*)
Euro
1,214
1,177
US Dollar
371
309
Chinese Renminbi (Yuan)
170
145
Brazilian Real
125
126
British Pound
151
141
Australian Dollar
34
35
Canadian Dollar
15
11
Norwegian Krone
13
10
Romanian Leu
28
23
United Arab Emirates Dirham
14
33
Turkish Lira
6
13
Malaysian Ringgit
14
19
Swedish Krona
13
14
Other currencies
87
61
Total
2,255
2,117
(*) The previously published prior year consolidated financial statements have been restated following the adoption of IFRS 10 and IFRS 11. Further details can
be found in Section C. Restatement of comparative figures.
(in millions of Euro)
(in millions of Euro)